简体中文
繁體中文
English
Pусский
日本語
ภาษาไทย
Tiếng Việt
Bahasa Indonesia
Español
हिन्दी
Filippiiniläinen
Français
Deutsch
Português
Türkçe
한국어
العربية
Gold Prices Aiming Lower After Chart Support Break
الملخص:Gold prices are aiming lower after breaking chart support to complete a bearish Head and Shoulders topping pattern. Crude oil prices are struggling below $65/bbl.
Gold prices edged higher despite a stronger US Dollar in what looked like a correction after the metal hit a four-month low. Lower bond yields against the backdrop of global slowdown fears after a worrying set of Eurozone PMI figures seemingly helped enable the tepid recovery.
Crude oil prices idled in familiar territory. A modest rise brought the WTI contract up off the monthly range floor but that was the extent of what buyers could muster. Perhaps traders were just not prepared to show directional commitment ahead of closures for a long holiday weekend in most major markets.
COMMODITY PRICE SPIKES POSSIBLE IN THIN LIQUIDITY
Liquidity has almost certainly drained to a trickle and will remain scarce while most of the worlds bellwether exchanges are shuttered, first for the Good Friday holiday and thereafter for Easter Monday. This probably means near-standstill for commodity prices until Tuesday.
Having said that, it is important to remember that over-the-counter spot commodities like gold never truly “close” and US markets return Monday, so crude oil futures will be open to trade. If a particularly eye-catching headline hits the wires, low participation levels may amplify any kneejerk volatility.
See the latest gold and crude oil forecasts to learn what will drive prices in the second quarter!
GOLD TECHNICAL ANALYSIS
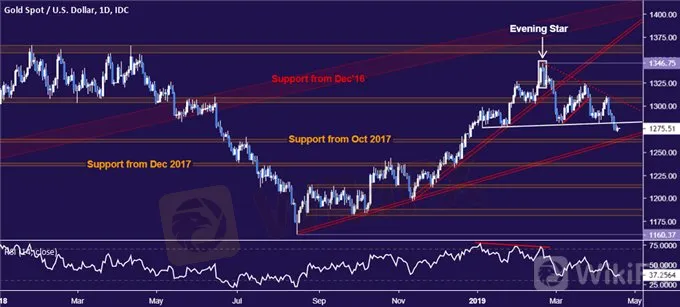
Gold prices paused to consolidate losses after completing a bearish Head and Shoulders (H&S) chart formation. Near-term support is in the 1260.80-63.76 area, with a break below that targeting the 1235.11-38.00 zone. More broadly, the H&S setup calls for a measured move down to 1215.00. Alternatively, breaking back above neckline support-turned-resistance at 1281.41 targets the 1303.70-09.12 region.
CRUDE OIL TECHNICAL ANALYSIS
Crude oil prices are treading water at resistance in the 63.59-64.88 area. A break above that as well as the follow-on 66.09-67.03 inflection zone sets the stage to challenge the $70/bbl figure. Alternatively, a daily close trend line support at 61.50 overturns the uptrend from December lows and sets the stage for deeper losses. The subsequent downside barriers come up at 60.39 and the 57.24-88 region.

عدم اعطاء رأي:
الآراء الواردة في هذه المقالة تمثل فقط الآراء الشخصية للمؤلف ولا تشكل نصيحة استثمارية لهذه المنصة. لا تضمن هذه المنصة دقة معلومات المقالة واكتمالها وتوقيتها ، كما أنها ليست مسؤولة عن أي خسارة ناتجة عن استخدام معلومات المقالة أو الاعتماد عليها.
وسيط WikiFX
أحدث الأخبار
شركة Digital Trades Group المراجعة الكاملة 2025 : موثوقة أم احتيال ؟
 WikiFX
تهنئة من WikiFX | عيدكم مبارك وكل عام وأنتم بخير
WikiFXشركة Olymp Trade المراجعة الكاملة 2025 : موثوقة أم احتيال ؟
WikiFXشركة IronFX المراجعة الكاملة 2025
WikiFXالتداول العكسي في الفوركس | ما هو وكيف يمكن استغلاله لتحقيق الربح؟
WikiFXحساب النسبة

