简体中文
繁體中文
English
Pусский
日本語
ภาษาไทย
Tiếng Việt
Bahasa Indonesia
Español
हिन्दी
Filippiiniläinen
Français
Deutsch
Português
Türkçe
한국어
العربية
Gold Prices May Break 9-Month Uptrend on US Jobs Report
الملخص:Gold prices may break below chart support guiding the nine-month uptrend as the Dollar rises in the wake of Aprils US jobs data.
GOLD & CRUDE OIL TALKING POINTS:
Gold prices perched atop 9-month trend support as US jobs data looms
US Dollar may rise on haven flows if labor market measures disappoint
Crude oil prices break 4-month uptrend as undersupply worries recede
Gold prices continued to drift lower Thursday as US Dollar extended gains alongside Treasury bond yields, building on moves triggered by the prior day‘s FOMC policy announcement. From here, all eyes turn to April’s US jobs report. A rise of 190k in nonfarm payrolls and a steady unemployment rate at 3.8 percent are expected. Wage inflation is seen firming to 3.3 percent on-year.
While such outcomes would be broadly in line with near-term trends, the recent trend toward disappointment relative to forecasts on US macro news-flow relative warns that a downside surprise may be in the cards. Leading activity survey data warns of the same. Soft results coupled with a Fed that is unconvinced of the need for stimulus may be inspire a risk-off response from financial markets.
The US central banks wait-and-see approach seems allow the US Dollar greater scope to capitalize on haven demand during periods of de-risking even as it limits scope for lower lending rates. That may set the stage for gold to weaken if investors turn defensive. Cycle-linked crude oil prices be likewise pressured as ebbing supply concerns remove a source of recent support.
The benchmark WTI contract plunged to a one-month low after EIA data showed that US inventories jumped by a whopping 9.93 million barrels last week, the most in almost six months. That put total stockpiles at the largest since September 2017. News that Russia exceeded its OPEC+ quota last month and comments from Iran warning of the cartels collapse if members cooperate with new US sanctions probably helped.
See the latest gold and crude oil forecasts to learn what will drive prices in the second quarter!
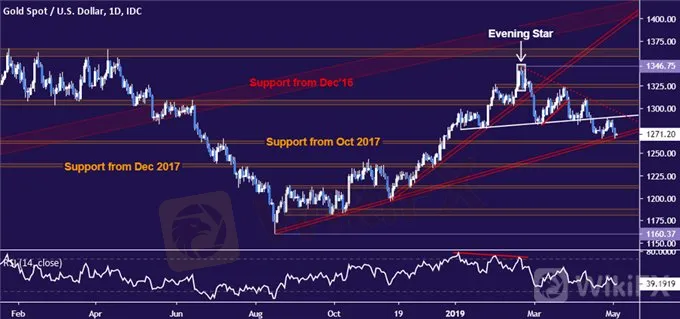
GOLD TECHNICAL ANALYSIS
Gold prices remain perched atop support in the 1260.80-63.76 area. Breaking below that on a daily closing basis overturns the uptrend from mid-August, initially exposing the 1235.11-38.00 zone next. Immediate resistance is marked by the recently broken neckline of a Head and Shoulders (H&S) topping pattern, now at 1290.40. A move above that puts the $1300/oz figure in the crosshairs. The H&S setup implies a measured downside objective at 1215.00.
CRUDE OIL TECHNICAL ANALYSIS
Crude oil prices broke trend line support defining the rally from late-December lows. Sellers now aim to challenge a minor downside barrier at 60.39, with a close below that exposing the 57.24-88 area. A dense layer of resistance runs all the way through 67.03. A recovery back above that sets the stage for a retest of the $70/bbl figure.

--- Written by Ilya Spivak, Currency Strategist for DailyFX.com
عدم اعطاء رأي:
الآراء الواردة في هذه المقالة تمثل فقط الآراء الشخصية للمؤلف ولا تشكل نصيحة استثمارية لهذه المنصة. لا تضمن هذه المنصة دقة معلومات المقالة واكتمالها وتوقيتها ، كما أنها ليست مسؤولة عن أي خسارة ناتجة عن استخدام معلومات المقالة أو الاعتماد عليها.
وسيط WikiFX
أحدث الأخبار
هل شركة FXTM موثوقة ؟ هل تستحق أن تضع ثقتك؟
 WikiFX
دليلك الشامل لفهم الفرق بين شركات التداول المرخصة وغير المرخصة
WikiFXهل شركة SQUAREDFINANCIAL موثوقة ؟ هل هي خيار آمن ؟
WikiFXXS.com توسّع أعمالها في الكويت بالشراكة مع NVEST
WikiFXتقييم شركة Anzo Capital . هل تستحق ثقتك ؟
WikiFXتقييم شركة 9Cents الشامل: هل شركة 9Cents موثوقة في عالم التداول؟
WikiFXأفضل شركات الفوركس الموثوقة في 2025: كيف تبدأ رحلة التداول بأمان مع تقييمات WikiFX
WikiFXحساب النسبة

