简体中文
繁體中文
English
Pусский
日本語
ภาษาไทย
Tiếng Việt
Bahasa Indonesia
Español
हिन्दी
Filippiiniläinen
Français
Deutsch
Português
Türkçe
한국어
العربية
Gold, Crude Oil Prices May Fall on Downbeat IMF Global Outlook
الملخص:Gold and crude oil prices may fall as the IMF sounds the alarm on slowing global growth, driving haven demand for the US Dollar.
GOLD & CRUDE OIL TALKING POINTS:
Gold prices lower as US Congress, White House reach debt ceiling deal
Crude oil prices torn between oversupply worries, Persian Gulf tensions
Downbeat IMF global growth forecast update may punish commodities
Gold prices edged down as bond yields and the US Dollarrose, sapping the appeal of non-interest-bearing and anti-fiat assets epitomized by the metal. The move appeared to be driven by news of a deal between Congressional Democrats and the White House to suspend the Federal debt limit for two years.
The accord amounts to raising budget caps by $320 billion. The move avoids a so-called “fiscal cliff”: Treasury Secretary Mnuchin has warned that the US might have missed debt payments in September without a deal. It also reduces the burden on the Fed to deliver policy stimulus via the monetary channel.
Crude oil prices idled in the meanwhile. Oversupply fears linked to cooling demand prospects courtesy of slowing global growth and near-record US output appeared to be offset by worries about shipment disruptions in the critical Strait of Hormuz waterway as Iran lashes out against US-driven export sanctions.
GOLD, CRUDE OIL PRICES MAY FALL ON DOWNBEAT IMF FORECAST UPDATE
An updated IMF World Economic Outlook might take center stage from here. The fund is likely to slash global growth forecasts further. With seemingly little room for this to stoke a deeper dovish shift in Fed policy bets – a go-to lifeline for gloomy markets recently – the result may be broad-based risk aversion.
To the extent that this inspires de-risking, it may put a premium on the unrivaled liquidity offered by the US Dollar, sending it higher at golds expense. Cycle-sensitive crude oil may likewise suffer, though geopolitics and incoming API inventories data may muddy matters. A 4.2-million-barrel drawdown is expected.
Get the latest gold and crude oil forecasts to see what will drive prices in the third quarter!
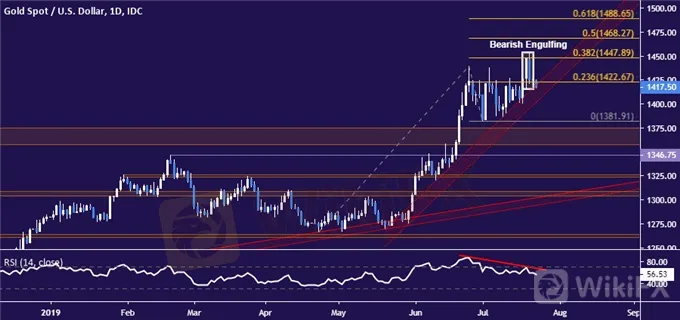
GOLD TECHNICAL ANALYSIS
The appearance of a Bearish Engulfing candlestick pattern coupled with negative RSI divergence warns that gold prices may be carving out a top. Confirmation on a break below rising trend support set from May – now at 1404.07 – initially targets the July 1 low at 1381.91. Alternatively, a push above resistance marked by the 38.2% Fibonacci expansion at 1447.89 aims for the 50% level at 1468.27 next.
CRUDE OIL TECHNICAL ANALYSIS
Crude oil prices continue to mark time above support at 54.84. Breaking below it on a daily closing basis initially exposes the next layer of support in the 49.41-50.60 area. Alternatively, a turn upward that brings prices above resistance at 58.19 sets the stage for another challenge of the 60.04-84 region.

COMMODITY TRADING RESOURCES
See our guide to learn about the long-term forces driving crude oil prices
Having trouble with your strategy? Heres the #1 mistake that traders make
Join a free webinar and have your commodity market questions answered
عدم اعطاء رأي:
الآراء الواردة في هذه المقالة تمثل فقط الآراء الشخصية للمؤلف ولا تشكل نصيحة استثمارية لهذه المنصة. لا تضمن هذه المنصة دقة معلومات المقالة واكتمالها وتوقيتها ، كما أنها ليست مسؤولة عن أي خسارة ناتجة عن استخدام معلومات المقالة أو الاعتماد عليها.
وسيط WikiFX
أحدث الأخبار
بناء الثقة واستكشاف الأفضل – WikiEXPO هونغ كونغ 2025 يختتم فعالياته بنجاح باهر
 WikiFX
شركة Webull المراجعة الكاملة 2025 : موثوقة أم احتيال ؟
WikiFXلماذا تكره شركات الفوركس استراتيجيات الاربيتراج والتداول عالي التردد (HFT)
WikiFXشركة Athens المراجعة الكاملة 2025 : موثوقة أم احتيال ؟
WikiFXإحذر من منصة إكسنوفا (Exnova) | عمليات احتيال والخطر يهدد أموالك
WikiFXشركة VI Markets المراجعة الكاملة 2025 : موثوقة أم احتيال ؟
WikiFXحساب النسبة

