简体中文
繁體中文
English
Pусский
日本語
ภาษาไทย
Tiếng Việt
Bahasa Indonesia
Español
हिन्दी
Filippiiniläinen
Français
Deutsch
Português
Türkçe
한국어
العربية
Gold Prices May Fall as US CPI Data Cools Fed Rate Cut Bets
الملخص:Gold prices may turn lower as US inflation data prints near the Feds target, cooling increasingly dramatic speculation about an incoming interest rate cut cycle.
GOLD & CRUDE OIL TALKING POINTS:
Gold prices probe higher, but chart setup warns of exhaustion
US CPI data may cool Fed rate cut bets, boost the US Dollar
Crude oil prices up on Aramco earnings, API inventories due
Gold prices rose as market-wide risk appetite unraveled once again, pushing bond yields lower alongside stocks and boosting the appeal of non-interest-bearing alternatives. The usually sentiment-geared crude oil prices managed to sidestep the selloff as Saudi state-owned oil giant Aramco revealed it slashed capital spending by a hefty 12 percent in the past year, stoking bets on reduced supply.
GOLD, CRUDE OIL PRICES MAY FALL AS US CPI DATA COOLS FED RATE CUT BETS
Looking ahead, Julys US CPI data dominates the spotlight. The core inflation rate is expected to print at 2.1 percent while the headline number ticks up from a four-month low to 1.7 percent on-year. While the Fed targets the perennially lower PCE measure of price growth (1.6 percent on-year as of June), outcomes in line with expectations may nevertheless cool Fed rate cut speculation.
As it stands, the markets are certain that more easing is due at next month‘s FOMC meeting, with a 67.7 percent chance of a 25bps cut and a nontrivial 32.4 percent probability of a 50bps one. For its part, the central bank has been far less exuberantly dovish in its guidance than investors’ bets imply. Firm CPI data might pointedly suggest that markets have over-extrapolated.
Gold prices seem likely to suffer if the baseline outlook for Fed monetary policy is adjusted to a relatively less-dovish setting. The shift would probably boost the US Dollar and undermine the appeal of a non-yielding anti-fiat alternative. The Greenbacks gains may be amplified as diminished scope for accommodation in the current jittery environment makes for a risk-off tilt to overall sentiment trends.
Crude oil may revert to its place on the pro-risk side of the global asset spectrum, which would make it vulnerable in this scenario. API inventory flow data might muddy the waters somewhat however. It will be judged against expectations of a 1.57-million-barrel drawdown expected to emerge out of official EIA numbers due Wednesday.
Get our free guide to help build confidence in your gold and crude oil trading strategy!
GOLD TECHNICAL ANALYSIS
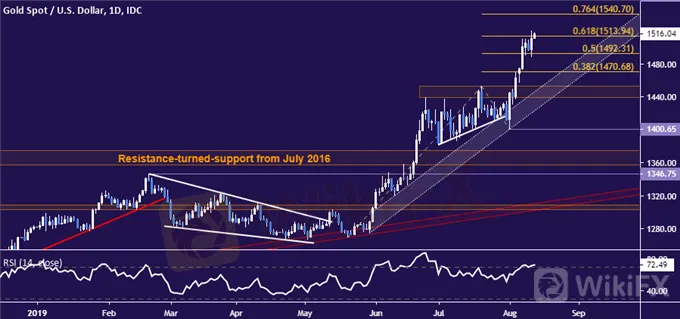
Gold prices are probing above the 61.8% Fibonacci expansion at 1513.94, with a break higher confirmed on a daily closing basis exposing the 76.4% level at 1540.70 next. Negative RSI divergence warns of ebbing upside momentum however, hinting that a turn might be brewing ahead. A turn back below the 50% Fib at 1492.31 initially targets the 38.2% expansion at 1470.68.
Gold price chart created using TradingView
CRUDE OIL TECHNICAL ANALYSIS
Crude oil prices are retesting the 54.72-56.09 inflection area, with a daily close above its upper layer exposing falling trend line resistance defining a broadly bearish bias since late May (now at 58.86). Immediate support is in the 49.41-50.60 zone. Slipping below that would put the spotlight on the 49.41-50.60 region next.

Crude oil price chart created using TradingView
COMMODITY TRADING RESOURCES
See our guide to learn about the long-term forces driving crude oil prices
Having trouble with your strategy? Heres the #1 mistake that traders make
Join a free webinar and have your commodity market questions answered
عدم اعطاء رأي:
الآراء الواردة في هذه المقالة تمثل فقط الآراء الشخصية للمؤلف ولا تشكل نصيحة استثمارية لهذه المنصة. لا تضمن هذه المنصة دقة معلومات المقالة واكتمالها وتوقيتها ، كما أنها ليست مسؤولة عن أي خسارة ناتجة عن استخدام معلومات المقالة أو الاعتماد عليها.
وسيط WikiFX
أحدث الأخبار
بناء الثقة واستكشاف الأفضل – WikiEXPO هونغ كونغ 2025 يختتم فعالياته بنجاح باهر
 WikiFX
شركة Webull المراجعة الكاملة 2025 : موثوقة أم احتيال ؟
WikiFXلماذا تكره شركات الفوركس استراتيجيات الاربيتراج والتداول عالي التردد (HFT)
WikiFXشركة Athens المراجعة الكاملة 2025 : موثوقة أم احتيال ؟
WikiFXإحذر من منصة إكسنوفا (Exnova) | عمليات احتيال والخطر يهدد أموالك
WikiFXشركة VI Markets المراجعة الكاملة 2025 : موثوقة أم احتيال ؟
WikiFXحساب النسبة

