简体中文
繁體中文
English
Pусский
日本語
ภาษาไทย
Tiếng Việt
Bahasa Indonesia
Español
हिन्दी
Filippiiniläinen
Français
Deutsch
Português
Türkçe
한국어
العربية
July FMS Fund Manager Survey: "The Dollar Is Significantly Undervalued"
Zusammenfassung:The monthly Fund Manager Survey (FMS) offers valuable insights into global capital flows from the perspective of institutional money managers. A notable takeaway from Julys report is that “Shorting th
The monthly Fund Manager Survey (FMS) offers valuable insights into global capital flows from the perspective of institutional money managers. A notable takeaway from July's report is that “Shorting the U.S. Dollar” has become one of the most crowded trades—echoing our earlier view that the dollar may have reached a bottom.
Whether you're trading stocks, managing derivatives, or planning everyday financial expenses, incorporating macroeconomic insights can help you avoid costly mistakes—and save yourself from paying the so-called “intelligence tax.”
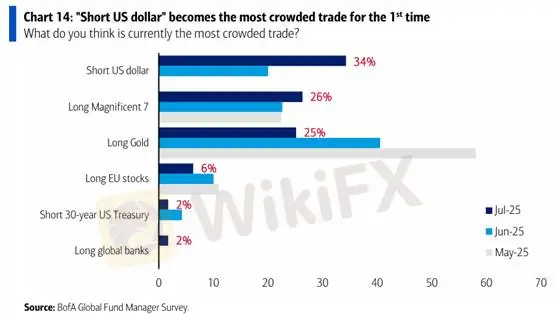
📊 Chart 1: “Short USD” Tops the List of Crowded Trades; Gold Falls to Third
Source: BOFA Global Fund Manager Survey
Since the start of the year, the U.S. Dollar Index has dropped from a high of 110.18 to a low of 96.38 before rebounding to 98.74. While there has been a flood of reasons cited for the dollar's weakness, four key themes have dominated:
Widening U.S. fiscal deficit
Recession fears triggered by tariffs
Expectations of future Fed rate cuts
Ongoing de-dollarization efforts
Hard landing expectations dropped from 49% in April to just 9%
“No landing” scenario projections rose from 3% to 21%
- 📊 Chart 2: Market Now Expects Soft or No Landing for Global Economy
📊
Chart 3: Cash Holdings Fall to 3.9%—a Cautionary Signal📊
Chart 4: Tech Stock Allocations Surge at Record Pace- 📊 Chart 5: Z-Score of 20-Year Allocation Trends – USD & U.S. Equities Still Underheld
Long USD
Short non-U.S. currencies
Crude oil (direction depending on recession fears)
Stop Loss: $3,357
Support Levels: $3,335 / $3,309
Resistance Levels: $3,343 / $3,351
However, market sentiment has shifted. These four narratives have faded from discourse, largely because the market has now accepted Trump‘s resolve on imposing tariffs. Improvements in the trade balance are now evident. Robust domestic consumption continues to anchor the U.S.’s relative economic strength, and foreign economies have struggled to counter U.S. tariffs. The market is aligning itself with this new reality.
Recession fears are also easing:
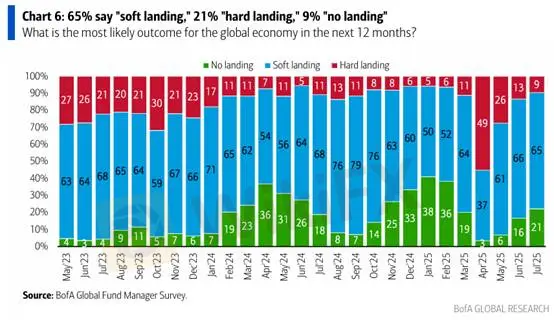
This shift in outlook makes it inevitable that recession expectations are declining. But the key question remains: are markets now overly optimistic or still too cautious?
U.S. equities have surged to new highs, yet many fund managers missed this rally. Retail investors have outperformed institutions in this cycle. Sentiment has now reached a euphoric stage, and cash levels held by fund managers have met the first condition for a de-risking signal.

In July, fund managers sharply increased their allocation to tech stocks—from 1% to 14%—the fastest rise since 2009.

That said, the largest equity overweights remain in the Eurozone and Emerging Markets. Allocations to the U.S. dollar and U.S. equities remain relatively low. When viewed through a 20-year lens, the dollar is currently 2 standard deviations below average, and U.S. equities are 1 standard deviation underweight—suggesting theres still room for reversal.
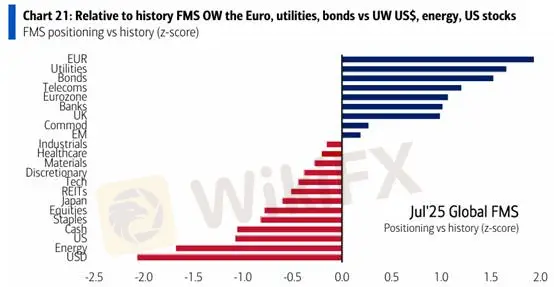
Assuming inventory destocking occurs in Q3, the Eurozone and Emerging Markets are likely to face the first wave of sell-offs, potentially triggering a strong rebound in the dollar. Both asset classes are still below their historical allocation averages.
This echoes a similar situation in 2022, where non-U.S. currencies depreciated while the U.S. dollar surged amid rate hikes and inflation control. Back then, smart money flocked to the ONRRP facility, sidestepping the equity and bond market drawdowns.
Currently, Eurozone allocations exceed their 20-year historical average by more than two standard deviations. If global inventory liquidation accelerates, capital outflows from the Eurozone could be more severe than expected. Meanwhile, EU negotiations over the “30% rule” remain unresolved—stay tuned for updates.
For now, the cleanest trades appear to be:
Other trades are becoming increasingly noisy. Commodities reaching local bottoms often signal a broader market pivot.
While we agree that the U.S. dollar remains undervalued, predicting whether gold will move inversely to the dollar remains tricky. Over the past two years, the correlation between gold and the dollar has been inconsistent. Compared to non-U.S. currencies, we hold lower conviction on golds outlook.
📈 Gold Technical Analysis
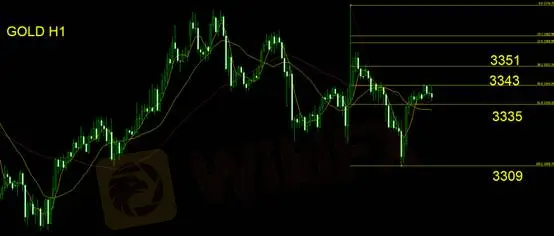
Gold has been in a downward-sloping consolidation channel. After dipping to $3,309, it bounced back and is now testing resistance near the 50% Fibonacci retracement level. The prior high was triggered by news that Trump may fire Fed Chair Jerome Powell, causing a $50 intraday swing in the dollar index.
We recommend treating this high as the Fibonacci reference point, with a bearish bias in your strategy. Enter short positions above $3,335. If prices fall back below $3,335, follow through with trend trades. Avoid long setups.
Haftungsausschluss:
Die Ansichten in diesem Artikel stellen nur die persönlichen Ansichten des Autors dar und stellen keine Anlageberatung der Plattform dar. Diese Plattform übernimmt keine Garantie für die Richtigkeit, Vollständigkeit und Aktualität der Artikelinformationen und haftet auch nicht für Verluste, die durch die Nutzung oder das Vertrauen der Artikelinformationen verursacht werden.
WikiFX-Broker
Wechselkursberechnung

