简体中文
繁體中文
English
Pусский
日本語
ภาษาไทย
Tiếng Việt
Bahasa Indonesia
Español
हिन्दी
Filippiiniläinen
Français
Deutsch
Português
Türkçe
한국어
العربية
Oil Price Technical Analysis: WTI to 55 - Can Sellers Take Control?

Extrait:Oil prices were back on offer yesterday after a confluent level of resistance came into play. But can sellers continue to push down to big-picture support?
Oil Price Talking Points:
WTI put in a flare of strength earlier this week, rising to an area of confluent resistance around the 57.34 level. Sellers re-emerged after that inflection and have since posed another push back-below 55.
Once prices tested below 55, however, the selling pressure began to slow. This has led to the build of a falling wedge pattern that may further hinder bearish approaches, at least temporarily.
It‘s been another busy week across global markets and concerns around slowing growth remain. This morning’s release of US retail sales figures may help to keep that worry at bay, at least for now, as retail sales increased last month by .7% versus the expectation for a .3% gain.
This growth concern has recently started to take a toll on Oil prices and as looked at earlier this month, price action in WTI tested a big zone of support on the chart that takes place just above the 50-handle. This was the same zone of prices that caught the decline in early-June before prices bounced back up to the 60-level. That support area came into play again on Wednesday of last week and led to a bounce up to 55 and buyers continued to push on Tuesday to bring prices all the way above 57.
From there, a bit of confluent resistance set in as taken from a bearish trend-line that intersects with the 38.2% Fibonacci retracement of the December-April major move.
WTI Crude Oil Four-Hour Price Chart
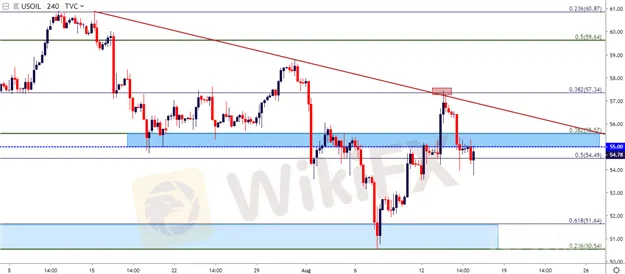
Chart prepared by James Stanley; Oil on Tradingview
Oil prices took another turn-lower after that resistance acme into play and have since pushed down to a fresh near-term low. Prices have pulled back, finding a bit of resistance off of the 55-handle again but, along the way have built into a falling wedge pattern. Such patterns will often be approached with the aim of bullish reversals, largely on the basis that sellers have been so shy around recent lows.
WTI Crude Oil Hourly Price Chart

Chart prepared by James Stanley; Oil on Tradingview
Oil Price Strategy
Given the build of a bullish reversal formation and this could mean that the bearish scenario may have to wait before a re-test of big-picture support above the 50-level might come back into play. Taking a step back to the daily chart helps to provide some scope, as the past few days have seen a penchant for selling pressure to dry up on tests below the 55-level.
WTI Crude Oil Daily Price Chart

Chart prepared by James Stanley; Oil on Tradingview
Oil Price Strategy Longer-Term
The bigger item of interest remains on the short-side of the matter as prices have continued to struggle since the turn in late-April. But – to date, Oil has yet to trade below the 50-handle since mid-January, keeping big-picture shorts at bay, at least for now. The big question is whether continued growth concerns or risk aversion might continue to push this theme, allowing for a break of the 50-level to open the door for a re-test of three-year-lows around 42.50; and for that, traders may need to wait for a bit.
The third test of support around 50.54 may be the one that opens the door for that theme but; given the near-term falling wedge combined with the continued support around 55.00, Oil bears may need to be a bit more patient before going for the big picture breakdown in Oil prices.
WTI Crude Oil Weekly Price Chart

Chart prepared by James Stanley; Oil on Tradingview
Avertissement:
Les opinions exprimées dans cet article représentent le point de vue personnel de l'auteur et ne constituent pas des conseils d'investissement de la plateforme. La plateforme ne garantit pas l'exactitude, l'exhaustivité ou l'actualité des informations contenues dans cet article et n'est pas responsable de toute perte résultant de l'utilisation ou de la confiance dans les informations contenues dans cet article.
Courtiers WikiFX
HFM
XM
Interactive Brokers
Saxo Banque
ATFX
FXTM
HFM
XM
Interactive Brokers
Saxo Banque
ATFX
FXTM
Courtiers WikiFX
HFM
XM
Interactive Brokers
Saxo Banque
ATFX
FXTM
HFM
XM
Interactive Brokers
Saxo Banque
ATFX
FXTM
Calcul du taux de change

