简体中文
繁體中文
English
Pусский
日本語
ภาษาไทย
Tiếng Việt
Bahasa Indonesia
Español
हिन्दी
Filippiiniläinen
Français
Deutsch
Português
Türkçe
한국어
العربية
Canadian Dollar Price Outlook: USD/CAD Faces Data and Central Bank Risks
Ikhtisar:The latest look at Canadian inflation data today will help guide USD/CAD traders but with the today‘s FOMC minutes and Fed Powell’s speech on Friday, the pair may be in for a rocky ride.
Canadian Dollar (CAD) Price, Chart and Analysis:
Canadian inflation is expected to slip below target, will the Bank of Canada react?
Will Fed chair Jerome Powell give the market any steer on the future path of US interest rates?
Q3 2019 Canadian Dollar (CAD) Forecast andTop Trading Opportunities
USD/CAD Shows Signs of Exhaustion as Risk Events Near
The latest look at Canadian inflation today is expected to show price pressures easing in July from 2% down to 1.7%, while the core reading is expected to nudge 0.1% lower to 2.1%. If either of these expectations are missed on the downside, markets will continue to price in a 0.25% interest rate cut at the next Bank of Canada meeting on September 4. While the Canadian economy remains strong, it is not immune to what is happening across the border in the US where US President Donald Trump is pushing the Federal Reserve to cut interest rates by more than the central bank is currently signaling. A 0.25% US rate cut is fully expected at the September 17-18 FOMC meeting and BoC governor Stephen Poloz may pre-empt the Fed if he feels that the domestic economy will suffer further from the global economic slowdown.
The latest FOMC minutes will be released later today and will be closely monitored for any language on the future path of interest rates. At this meeting the Fed cut rates by 0.25%, calling it a ‘mid-cycle adjustment’ and traders will want to see if anything has changed since then. Powell will also be speaking at the Jackson Hole Symposium on Friday and may use this stage to give a further steer on the US economy and any necessary monetary policy reaction.
Keep up to date with all key economic data and event releases via the DailyFX Economic Calendar
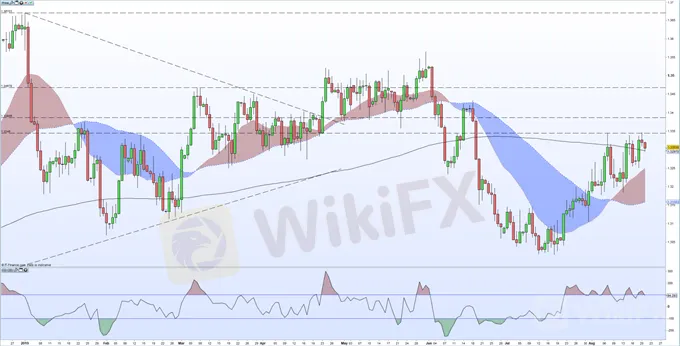
USD/CAD has failed to break back above horizontal resistance around the 1.3345 – 1.3350 level despite the uptrend starting in early July remaining intact. The pair are currently finding support off the 200-day moving average – currently just below 1.3300 –but the CCI indicator shows the market remains overbought. A break below the 200-dma opens the way back to the 1.3250 area before 1.3183 and 1.3177 come into play. To the upside, a break and close above 1.3350 zone opens the way to the June 20 high at 1.3433.
USD/CAD Daily Price Chart (December 2018 – August 21, 2019)
Traders may be interested in two of our trading guides – Traits of Successful Traders and Top Trading Lessons – while technical analysts are likely to be interested in our latest Elliott Wave Guide.
What is your view on the Canadian Dollar (CAD) – bullish or bearish? You can let us know via the form at the end of this piece or you can contact the author at nicholas.cawley@ig.comor via Twitter @nickcawley1.
Disclaimer:
Pandangan dalam artikel ini hanya mewakili pandangan pribadi penulis dan bukan merupakan saran investasi untuk platform ini. Platform ini tidak menjamin keakuratan, kelengkapan dan ketepatan waktu informasi artikel, juga tidak bertanggung jawab atas kerugian yang disebabkan oleh penggunaan atau kepercayaan informasi artikel.
WikiFX Broker
Berita Terhangat
Pengumuman WikiFX: Penghentian Kompetisi Simulasi Trading Mingguan
 WikiFX
DENDA Lampaui €2,7 Juta ! Tekanan Peraturan Baru Uni Eropa pada Perusahaan Keuangan Siprus
WikiFXWawancara Pakar Global WikiEXPO: JinDao Tai — Masa Depan Perdagangan Valas
WikiFXPotensi KEHILANGAN $274 Juta Apabila ASIC Melikuidasi Dana Investasi Bermasalah
WikiFXLisensi Broker Lepas Pantai Membuka Peluang Prop Firm Terhadap Metatrader 5
WikiFXTransformasi Perombakan SEC, Pakar Peringatkan "Kematian Akibat 1.000 Pemotongan”
WikiFXBroker Forex ICM Peroleh Lisensi di UEA Setelah Setahun Keluar dari Inggris
WikiFXMenjembatani Kepercayaan, Menjelajahi yang Terbaik WikiEXPO Hong Kong 2025 Berakhir Spektakuler
WikiFXNilai Tukar

