简体中文
繁體中文
English
Pусский
日本語
ภาษาไทย
Tiếng Việt
Bahasa Indonesia
Español
हिन्दी
Filippiiniläinen
Français
Deutsch
Português
Türkçe
한국어
العربية
Dow Jones Forecast: History Suggests FOMC Policy May Buoy Index

요약:Historical performance suggests the Feds accommodative monetary policy may outweigh growth concerns, thereby bolstering the Dow Jones.
Dow Jones Forecast Talking Points:
The Dow Jones looks to dovish monetary policy for trend continuation purposes
The Feds accommodative plan may outweigh concerns over domestic growth
For a deeper look into the equity space, sign up for my weekly webinar - Stock Market Catalysts in the Week Ahead
Dow Jones Forecast: History Suggests FOMC Policy May Buoy Index
While Wednesday‘s FOMC meeting fell largely within market expectations, March’s Summary of Economic Projections (SEP) offered a bleaker outlook for the US economy. With the Feds policy outlook solidified, the Dow Jones now faces conflicting fundamental themes. However, history may suggest lower GDP forecasts are not necessarily bad news for the Dow Jones.
Dow Jones Price Chart: Daily Time Frame (June 2018 – March 2019) (Chart 1)
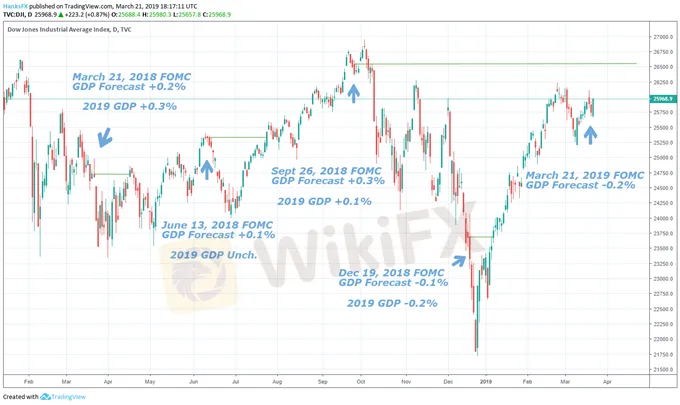
Since last years March FOMC meeting, all five meetings with fresh updates on forecasts saw a change in the GDP outlook for the US economy. It is important to note that each quarterly event in 2018 also accompanied a 25-basis point increase to the interest rate range, a fundamentally bearish development for equities.
Learn the differences between the Dow Jones and the S&P 500
That said, three of the five GDP forecast updates were upward revisions. Each subsequently saw the Dow Jones trade lower in the week/s that followed as the case for future hikes was bolstered alongside an immediate rate increase. The March, June and September FOMC meetings saw an average decline of 1.81% in the following five trading days. In the following three weeks, each event preceded an average decline of 3.27%.
View our Economic Calendar for big events scheduled in the week ahead.
In comparison, lower adjustments to the US GDP horizon were followed by more mixed performance. December‘s meeting - the last to be accompanied with an interest rate hike – declined 3.05% in the subsequent five trading days and rose 0.6% in the following three weeks. It is worth noting the extreme volatility in the Dow Jones around December’s FOMC meeting, exacerbated by holiday conditions.
Dow Jones Price Chart: 1 - Hour Time Frame (November 2018 – March 2019) (Chart 2)

The decision to hike rates at December‘s meeting followed a dovish shift from Fed Chairman Powell in late November and the potential to pause rate hikes in 2019, which markets have now realized fully. In its most recent insights, the group’s median outlook calls for changes in the interest rate through the year while the years GDP forecast was lowered from 2.3 to 2.1 percent. Given the past performance of the Dow Jones following downward GDP revisions and their impact on the case for future hikes, the days ahead may see the Average continue Thursdays rally as the impacts of dovish monetary policy overwhelm concerns of lower domestic growth.
면책 성명:
본 기사의 견해는 저자의 개인적 견해일 뿐이며 본 플랫폼은 투자 권고를 하지 않습니다. 본 플랫폼은 기사 내 정보의 정확성, 완전성, 적시성을 보장하지 않으며, 개인의 기사 내 정보에 의한 손실에 대해 책임을 지지 않습니다.
WikiFX 브로커
환율 계산기

