简体中文
繁體中文
English
Pусский
日本語
ภาษาไทย
Tiếng Việt
Bahasa Indonesia
Español
हिन्दी
Filippiiniläinen
Français
Deutsch
Português
Türkçe
한국어
العربية
Gold Prices at Key Technical Barrier, Crude Oil Prices Vulnerable
요약:Gold prices are pushing up against make-or-break technical resistance. Crude oil prices may fall if global slowdown fears and a downbeat IEA report.
GOLD & CRUDE OIL TALKING POINTS:
Gold prices testing potentially trend-defining chart resistance
Crude oil prices continue to stall below the $65/barrel figure
Event risk lull may bring risk-off dynamics, IEA report on tap
Gold prices rose after a grim ECB monetary policy announcement spooked markets and drove yields downward, boosting the appeal of non-interest-bearing assets. The US Dollar initially popped higher as downbeat comments from President Mario Draghi crossed the wires – anchoring the yellow metal – but a swift subsequent reversal removed this hurdle.
US CPI data showing core inflation unexpectedly fell in March coupled with early reports of a draft deal to delay Brexit at an emergency EU leaders‘ summit may have set the stage for the Greenback’s reversal. Data reinforcing a dovish stance from the US central bank coupled with avoiding a disorderly EU/UK divorce – at least for now – sent the bellwether S&P 500 upward, punishing the anti-risk currency.
Crude oil prices mostly reflected sentiment trends, rising alongside shares in the latter half of the day. EIA inventory flow data revealing a larger-than-expected 7.03-million-barrel rise in crude stockpiles last week was mostly overlooked. Later in the day, minutes from the March FOMC meeting seemingly registered less dovish than markets accounted for, setting a session low for USD and high for commodities.
CRUDE OIL MAY FALL ON RISK TRENDS, IEA REPORT
From here, a lull in top-tier event risk might make for a period of consolidation. Alternatively, the absence of immediate distractions – at least of the scheduled variety – may allow investors to refocus on the increasingly worrying macro backdrop. Crude oil prices may fall if this pushes sentiment into risk-off territory. A monthly IEA oil market report may flag ebbing demand and swelling supply, compounding pressure.
See the latest gold and crude oil forecasts to learn what will drive prices in the second quarter!
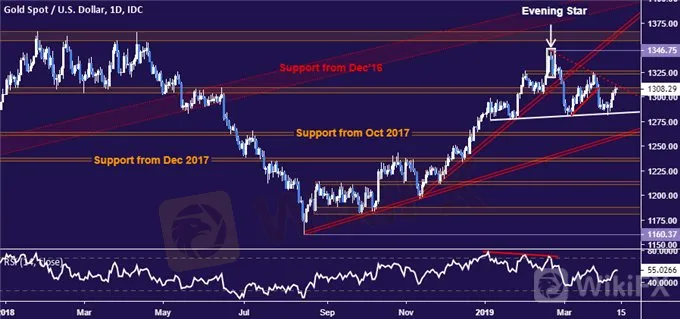
GOLD TECHNICAL ANALYSIS
Gold prices are testing resistance in the 1303.70-09.12 area, a barrier marked by a chart inflection area and a falling trend line capping gains since late February. A daily close above sees the next upside barrier at 1326.30. More broadly, such move would hint at the completion of a bullish Triangle continuation pattern, setting the stage for longer-term recovery.
Alternatively, a turn lower from here that leads to a break of neckline support at 1283.53 would point to the completion of a Head and Shoulders (H&S) top. That would set the stage for a test of rising trend support established from August 2018 lows, now 1258.34. The H&S formation would imply a larger selloff to probe near the $1200/oz figure.
CRUDE OIL TECHNICAL ANALYSIS
Crude oil prices continue to test support-turned-resistance in the 63.59-64.88 area. A daily close above it would bring the 66.09-67.03infection zone immediately into focus, with a subsequent breach of that opening the door for a move to challenge the $70/bbl figure. A break below rising trend support set from late December – now at 60.39 – is needed to neutralize immediate upward pressure, exposing the 57.24-88 region next.

면책 성명:
본 기사의 견해는 저자의 개인적 견해일 뿐이며 본 플랫폼은 투자 권고를 하지 않습니다. 본 플랫폼은 기사 내 정보의 정확성, 완전성, 적시성을 보장하지 않으며, 개인의 기사 내 정보에 의한 손실에 대해 책임을 지지 않습니다.
WikiFX 브로커
최신 뉴스
신뢰를 구축하고, 최상의 기회를 탐색하다(Bridging Trust, Exploring Best)—WikiEXPO Hong Kong 2025 성황리에 종료
 WikiFX
WikiEXPO 글로벌 전문가 인터뷰: 진다오 타이(JinDao Tai) — 외환 거래의 미래
WikiFX환율 계산기

