简体中文
繁體中文
English
Pусский
日本語
ภาษาไทย
Tiếng Việt
Bahasa Indonesia
Español
हिन्दी
Filippiiniläinen
Français
Deutsch
Português
Türkçe
한국어
العربية
Crude Oil and Gold Prices May Fall Further on BOE Rate Decision

요약:Gold prices may fall – making good on technical clues pointing to topping – as the Federal Reserve shies away from endorsing the markets ultra-dovish policy outlook.
CRUDE OIL & GOLD TALKING POINTS:
Gold prices fell as the Fed cooled rate cut bets, validating topping cues
Crude oil prices testing three-month trend resistance near $60/bbl mark
Risk appetite may sour as BOE warns on growth but holds back stimulus
Crude oil and gold prices fell as the Federal Reserve poured cold water on the markets ultra-dovish policy outlook even as it lowered the benchmark lending rate by 25bps, as expected. The WTI contract fell alongside stocks as rate cut bets evaporated, souring risk appetite. The yellow metal suffered as an upshift in yields and the US Dollar tarnished the appeal of anti-fiat alternatives.
More of the same may be ahead as the Bank of England issues its own policy decision. It will probably repeat concerns about slowing global growth even as it shies away from doing anything about them amid Brexit-linked uncertainty. Governor Carney and company probably want to save as much firepower as they can muster for a scenario where a no-deal exit from the EU sends the economy into a tailspin.
Get the latest crude oil and gold forecasts to see what will drive prices in the third quarter!
GOLD TECHNICAL ANALYSIS
Gold prices broke downward after putting in a Bearish Engulfing candlestick pattern coupled with negative RSI divergence, as expected. Prices have now cleared support levels guiding upward progress since late May. This hints that the bias has shifted to favor the downside, putting a dense support bloc running down through 1346.75 in focus. Invalidating bearish cues requires a daily close above the July 19 high at 1452.95.
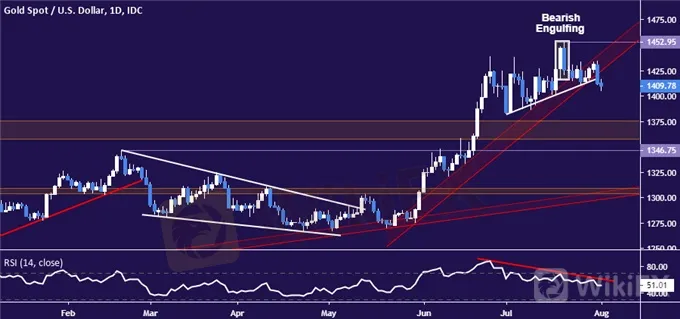
Gold chart created using TradingView
CRUDE OIL TECHNICAL ANALYSIS
Crude oil prices edged up to challenge resistance capping gains since late April. A daily close above it and the 60.04-84 congestion area that follows immediately thereafter exposes the 63.59-64.43 zone. Alternatively, a break below support at 54.72 targets the 49.41-50.60 region.

Crude oil chart created using TradingView
COMMODITY TRADING RESOURCES
See our guide to learn about the long-term forces driving crude oil prices
Having trouble with your strategy? Heres the #1 mistake that traders make
Join a free webinar and have your commodity market questions answered
면책 성명:
본 기사의 견해는 저자의 개인적 견해일 뿐이며 본 플랫폼은 투자 권고를 하지 않습니다. 본 플랫폼은 기사 내 정보의 정확성, 완전성, 적시성을 보장하지 않으며, 개인의 기사 내 정보에 의한 손실에 대해 책임을 지지 않습니다.
WikiFX 브로커
환율 계산기

