简体中文
繁體中文
English
Pусский
日本語
ภาษาไทย
Tiếng Việt
Bahasa Indonesia
Español
हिन्दी
Filippiiniläinen
Français
Deutsch
Português
Türkçe
한국어
العربية
Gold Price Outlook: XAUUSD Spikes, Snaps Back to Fibonacci Support

요약:Gold prices continued their bullish ascent this morning, spiking above the 1555 level after the open. Most of those gains have already been faded-out.
Gold Price Outlook Talking Points:
It was a wild finish to last week for Gold prices as a strong breakout showed on Friday. That theme continued with a quick spike to start this weeks trade, but much of that has already been faded-out with price action returning to the Friday close level.
Gold prices remain overbought on a longer-term look but a potent backdrop of fundamental drivers has continued to bring bulls to the bid.
DailyFX Forecasts are published on a variety of markets such as Gold, the US Dollar or the Euro and are available from the DailyFX Trading Guides page. If youre looking to improve your trading approach, check out Traits of Successful Traders. And if youre looking for an introductory primer to the Forex market, check out our New to FX Guide.
Gold Prices Spike at the Open, Snap Back Fades Gains
Given the weekend events, risk aversion spiked at the open with Gold prices temporarily trading-above the 1555 level. That move has since pulled back with almost the entirety of those gains now given back and price action returning back towards last weeks close.
Gold Price Four-Hour Chart
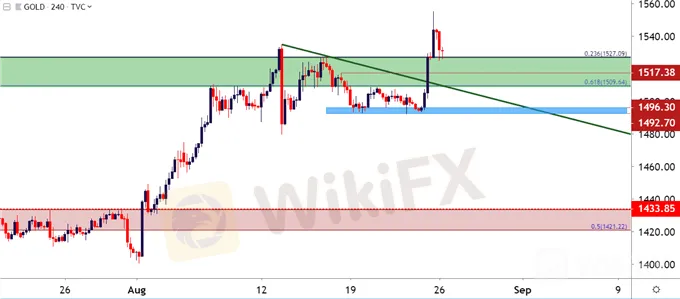
Chart prepared by James Stanley; Gold on Tradingview
This collectively produces a fairly bright backdrop on the fundamental side of Gold prices. Ongoing trade tensions will likely be met with softer monetary policy out of the Fed; both factors that can further contribute to bullish stances in Gold. =The issue at the moment is in just how strong this theme has been getting priced-in with Gold prices moving to their most overbought state since 2011, right around the time that price action topped-out above the 1900 level. Since those lows last August, Gold prices have gained as much as 34% going out to this mornings swing-high.
Gold Weekly Price Chart

Chart prepared by James Stanley; Gold on Tradingview
Gold Price Strategy
Given the overbought longer-term backdrop with a fundamental scenario that could continue to lead to further gains, and traders have a couple of options for approaching the topside of Gold at the moment. Breakout potential remains, looking for spikes to fresh highs to carry on. This would be similar to the setup looked at last week in which breakout potential existed at the Fibonacci levels of 1509 up to the 1527 marker.
Alternatively, traders can look pullbacks to support that could re-open the door for defined risk plays. Key for such approaches will be actually confirming that support is actually showing at the level so that stops can be held below those lows; and if prices do continue to break-down, losses could be mitigated, and bullish entries could be re-examined later.
Aggressive support could be sought out around the current level should buyers help to hold the lows here today. This comes in at 1527 and this price provided a bit of resistance on Friday as well as a lower-high two weeks ago. This is the 23.6% Fibonacci retracement of the 1999-2011 major move in Gold. A bit-lower is another Fibonacci level of interest at 1509, as this is the 61.8% marker of the 2012-2015 sell-off. And below that is the zone that helped to hold last weeks lows that runs from the approximate 1492-1496.
Gold Price Two-Hour Chart

Chart prepared by James Stanley; Gold on Tradingview
면책 성명:
본 기사의 견해는 저자의 개인적 견해일 뿐이며 본 플랫폼은 투자 권고를 하지 않습니다. 본 플랫폼은 기사 내 정보의 정확성, 완전성, 적시성을 보장하지 않으며, 개인의 기사 내 정보에 의한 손실에 대해 책임을 지지 않습니다.
WikiFX 브로커
환율 계산기

