简体中文
繁體中文
English
Pусский
日本語
ภาษาไทย
Tiếng Việt
Bahasa Indonesia
Español
हिन्दी
Filippiiniläinen
Français
Deutsch
Português
Türkçe
한국어
العربية
Gold Price Rise May Extend But Signs of Exhaustion Are Emerging
Resumo:Gold prices may continue inching upward but technical cues pointing to ebbing momentum are warning of a possible pullback before the broader rise resumes.
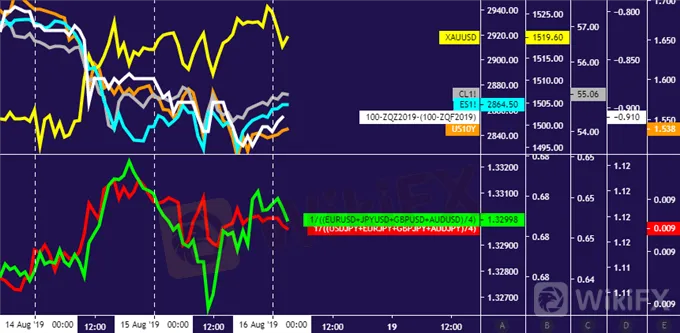
Crude oil, gold price performance chart created using TradingView
GOLD & CRUDE OIL TALKING POINTS:
Gold prices may rise as markets tilt risk-off before the weekend
Crude oil prices vulnerable, might move to retest $50/bbl figure
Progress may be limited before FOMC minutes, Jackson Hole
Commodity prices idled Thursday as a lull in pace-setting news flow made room to digest recent volatility. From here, a relatively quiet offering on the economic data docket seems likely to keep broad-based market sentiment trends in control. The path of least resistance favors a risk-off scenario.
Sudden bursts of volatility have become increasingly common recently as prices react to eye-catching headlines from Washington and Beijing amid US-China trade war escalation. This probably has traders more leery than usual of holding pro-risk exposure over the weekend.
With that in mind, a round of defensive liquidation might pull down cycle-sensitive crude oil prices alongside stocks. A parallel dip in bond yields might have scope to push up gold, especially since the metal has managed gains even as the US Dollar trades higher recently.
Absent a burst of headline-driven volatility however, significant trend development seems unlikely. The week ahead brings critical inflection points in the Fed policy outlook – a defining macro input – by way of FOMC minutes and the Jackson Hole symposium. Commitment may be scarce in the interim.
GOLD TECHNICAL ANALYSIS
Gold prices are inching toward resistance at 1540.70, the 76.4% Fibonacci expansion. A daily close above that exposes a weekly chart inflection level at 1563.00 next. Negative RSI divergence hints upside momentum is ebbing however. A turn below the 61.8% Fib at 1513.94 targets the 50% level at 1492.31.

Gold price chart created using TradingView
CRUDE OIL TECHNICAL ANALYSIS
Crude oil prices slipped back below the lower bound of the 54.72-56.09 congestion area, breaking the weekly uptrend in the process. Sellers may now move test the 49.41-50.60 zone anew. A daily close above trend resistance set from late April – now at 58.53 – seems necessary to neutralize downward pressure.

Crude oil price chart created using TradingView
Isenção de responsabilidade:
Os pontos de vista expressos neste artigo representam a opinião pessoal do autor e não constituem conselhos de investimento da plataforma. A plataforma não garante a veracidade, completude ou actualidade da informação contida neste artigo e não é responsável por quaisquer perdas resultantes da utilização ou confiança na informação contida neste artigo.
Corretora WikiFX
Corretora WikiFX
Últimas notícias
RSI e RCI no Forex: Como Otimizar Suas Estratégias de Trading
 WikiFX
Ouro Hoje (04/07/2025): Estratégias de Investimento para Aproveitar a Alta do Ativo
WikiFXSTARTRADER: Vale a Pena Investir? Conheça essa Corretora Australiana Fundada em 1997!
WikiFXDólar Hoje: Moeda Fica na Casa dos R$ 5,42 com a Derrubada do Decreto do IOF
WikiFXWarren Bowie & Smith: Trader Colombiano Perde U$S 1.320 em Mais um Golpe
WikiFXCuentaFX: Investidor Mexicano Relata Manipulação de Operações e Vendas Pressionadas
WikiFXAtaque Hacker à C&M Software Desvia até R$ 1 Bi: Aprenda a se Proteger!
WikiFXCálculo da taxa de câmbio

