简体中文
繁體中文
English
Pусский
日本語
ภาษาไทย
Tiếng Việt
Bahasa Indonesia
Español
हिन्दी
Filippiiniläinen
Français
Deutsch
Português
Türkçe
한국어
العربية
Gold, Crude Oil Prices at Risk if US Jobs Data Cools Rate Cut Bets
Resumo:Gold and crude oil prices may be pressured if upbeat US employment figures cool Fed interest rate cut prospects, souring sentiment across markets pining for stimulus.
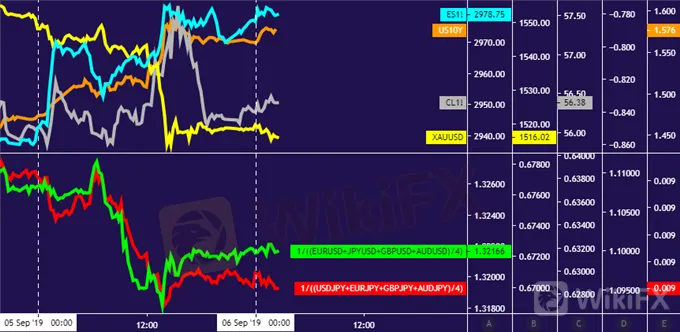
Crude oil, gold price performance chart created using TradingView
GOLD & CRUDE OIL TALKING POINTS:
Gold prices tumble through support as US data cools Fed rate cut bets
Crude oil prices fail to capitalize despite broadly supportive news flow
Commodities may fall if US employment report tops baseline forecasts
Gold prices fell as upbeat US economic data cooled Fed rate cut bets, driving bond yields higher and undermining the appeal of non-interest-bearing assets epitomized by the metal (as expected). A private sector estimate of jobs growth from ADP topped forecasts, factory orders rose by the most in 11 months and ISM survey data showed the service sector unexpectedly grew at the fastest rate since May.
The report showed US stockpiles shed 4.77 million barrels last week, dwarfing the 2.57-million-barrel draw expected and the surprise rise telegraphed in analogous API statistics. Larger-than-expected outflows from refined-product storage were also recorded. Nevertheless, prices turned down after touching a one-month high, erasing nearly all of their intraday advance before the closing bell.
GOLD, CRUDE OIL PRICES AT RISK IF US JOBS DATA COOLS FED RATE CUT BETS
Looking ahead, August‘s US jobs data is firmly in focus. It is expected to show that the economy added 160k jobs, marking a broadly on-trend outcome. The unemployment rate is seen holding steady at 3.7 percent, a hair above 50-year lows, while wage growth moderates a bit to print at a still-firm 3 percent on-year. US data’s recent improvement relative to forecasts hints a rosier report may well be in the cards.
A risk-off tilt seems likely to drive crude oil prices downward. Gold might have capitalized if the defensive were to produce the usual downward pressure on bond yields, but scope for such a thing seems limited when the prospect of higher-than-hoped-for lending rates is itself the catalyst for weakness. Against this backdrop, a relatively flat result might be the most that the anti-fiat benchmark can hope for.
Get our free guide to help build confidence in your gold and crude oil trading strategy!
GOLD TECHNICAL ANALYSIS
Gold prices marked a near-term top below resistance at 1563.00 – a weekly chart inflection level – as expected. A breach of support guiding gains over the past month sets the stage to challenge Augusts low at 1480.00. Breaking below that on a daily closing basis targets the 1437.70-52.95 zone next.

Gold price chart created using TradingView
CRUDE OIL TECHNICAL ANALYSIS
Crude oil prices put in a Shooting Star candlestick at resistance set from late April, hinting at a downturn in the works. Negative RSI divergence bolsters the bearish argument. Breaking below the August 26 low at 52.96 eyes support near $50/bbl next. Alternatively, a close above resistance exposes the 60.04-84 area.

Crude oil price chart created using TradingView
COMMODITY TRADING RESOURCES
Isenção de responsabilidade:
Os pontos de vista expressos neste artigo representam a opinião pessoal do autor e não constituem conselhos de investimento da plataforma. A plataforma não garante a veracidade, completude ou actualidade da informação contida neste artigo e não é responsável por quaisquer perdas resultantes da utilização ou confiança na informação contida neste artigo.
Corretora WikiFX
Últimas notícias
RSI e RCI no Forex: Como Otimizar Suas Estratégias de Trading
 WikiFX
STARTRADER: Vale a Pena Investir? Conheça essa Corretora Australiana Fundada em 1997!
WikiFXDólar Hoje: Moeda Fica na Casa dos R$ 5,42 com a Derrubada do Decreto do IOF
WikiFXWarren Bowie & Smith: Trader Colombiano Perde U$S 1.320 em Mais um Golpe
WikiFXCuentaFX: Investidor Mexicano Relata Manipulação de Operações e Vendas Pressionadas
WikiFXAtaque Hacker à C&M Software Desvia até R$ 1 Bi: Aprenda a se Proteger!
WikiFXCálculo da taxa de câmbio

