简体中文
繁體中文
English
Pусский
日本語
ภาษาไทย
Tiếng Việt
Bahasa Indonesia
Español
हिन्दी
Filippiiniläinen
Français
Deutsch
Português
Türkçe
한국어
العربية
Gold Price Weekly Outlook: Gold Rips to 5-Year Highs- Buyers Beware

Абстракт:Gold prices are poised to post the largest weekly advance in three years with price probing key resistance. These are the levels that matter on the XAU/USD weekly chart.
Gold price rally testing resistance at 2014 highs- trade remains constructive above 1327
2014年高位的黄金价格反弹测试阻力仍高于1327
Gold prices are up more than 4.1% this week and for a fifth consecutive weekly advance in XAU/USD. The rally marks the largest single-week advance since April of 2016 with price now probing a key resistance zone at fresh five-year highs. These are the updated targets and invalidation levels that matter on the XAU/USD weekly price chart. Review my latestWeekly Strategy Webinar for an in-depth breakdown of this setup and more.
本周黄金价格上涨超过4.1%,连续第五个月上涨每周XAU / USD的预付款。此反弹是自2016年4月以来单周最大涨幅,价格正在探讨新的五年高点的关键阻力区。这些是XAU / USD每周价格图表中重要的更新目标和失效水平。查看我的最新周刊策略网络研讨会,深入了解此设置及其他内容。
Gold Price Chart - XAU/USD Weekly
黄金价格走势图 - XAU / USD每周
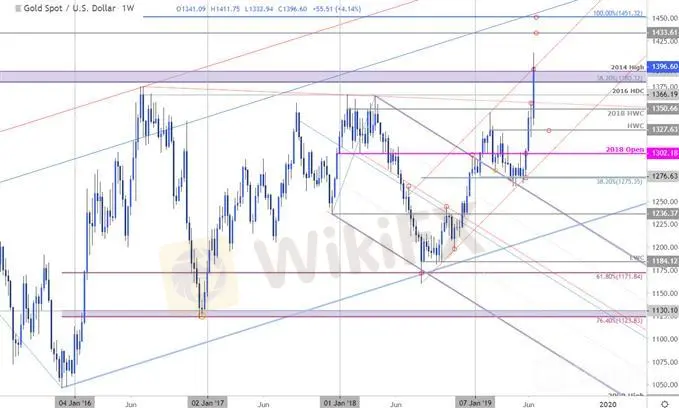
Notes: In my last Gold Price Outlook we noted that the, “The weekly opening-range is set in Gold heading into the FOMC interest rate decision later today – look for the break…. A topside breach keeps the focus on subsequent resistance objectives at the 2016 high-week close at 1366 and the 38.2% retracement / 2014 high at 1380/92 (critical).” A breakout post-Fed led the advance with the rally taking XAU/USD to fresh multi-year highs (high registered at 1411). The focus is on a weekly close heading into Friday with price now testing key resistance at 1380/92 – note that basic parallel / channel resistance converges on this zone and further highlights its technical significance.
注意:在我上一次的黄金价格展望中我们他指出,“每周开盘价将在今天晚些时候进入FOMC利率决定的黄金中设定 - 寻找突破......上行突破将重点关注2016年高点收盘时的后续阻力目标1366和38.2%的回撤/ 2014年高点1380/92(关键)。”美联储突破后领涨,随着反弹走高XAU /美元兑新的多年高位(高位于1411)。重点是每周收盘前进至周五,目前价格测试关键阻力位于1380/92 - 注意基本平行/通道阻力汇聚于该区域,并进一步凸显其技术意义。
{10}
A close above this threshold keeps the focus on subsequent topside objectives at 1433 and the 100% extension of the late-2015 advance at 1451- look for a bigger reaction there IF reached. Interim support now 1366 backed by the 2018 high-week close at 1350. Broader bearish invalidation now raised to the February high-week close at 1327.
{10}
Bottom line: The immediate focus is on a weekly close above this critical resistance zone at multi-year highs. A close above 1392 would keep the immediate long-bias viable heading into the final week of June trade. Failure here would highlight the risk for near-term exhaustion. From a trading standpoint, a good place to reduce long-exposure / raise protective stop. Ultimately, a pullback would offer more favorable entries closer to the former 2016 trendline. Ill publish an updated Gold Price Outlook once we get further clarity in near-term price action next week. Review our latest Gold 2Q forecasts for a longer-term look at the technical picture for XAU/USD prices.
底线:当前关注的是每周收盘高于这个关键阻力区的多年高点。收盘价高于1392将使即时长期偏见继续进入6月交易的最后一周。这里的失败会突显近期疲惫的风险。从交易的角度来看,这是减少长时间曝光/提高保护性停止的好地方。最终,回调将提供更接近前2016年趋势线的更有利的参赛作品。我们将在下周进一步明确近期价格行动后,发布更新的黄金价格展望。查看我们最新的黄金2Q预测,以便长期了解XAU / USD价格的技术图片。
Gold Trader Sentiment (XAU/USD)
黄金交易员情绪(XAU / USD)
{15}

A summary of IG Client Sentiment shows traders are net-long Gold - the ratio stands at +1.37 (57.8% of traders are long) – weak bearish reading
{15}
Long positions are 11.5% higher than yesterday and 6.3% higher from last week
多头头寸比昨天增加11.5%,比上周增加6.3%
Short positions are 1.3% lower than yesterday and 3.6% higher from last week
空头头寸比昨天减少1.3%,比上周增加3.6%
We typically take a contrarian view to crowd sentiment, and the fact traders are net-long suggests Gold prices may continue to fall. Traders are further net-long than yesterday & last week, and the combination of current positioning and recent changes gives us a stronger Gold price (XAU/USD) -bearish contrarian trading bias from a sentiment standpoint.
我们通常采取逆向观点来看待人群情绪,事实上交易者是净多头意味着黄金价格上涨y继续下降。交易商比昨天和上周进一步净多头,目前定位和近期变化的结合使我们的黄金价格更加强劲(XAU / USD)从情绪的角度来看,看跌逆势交易偏见。
Previous Weekly Technical Charts
以前的每周技术图表
Kiwi (NZD/USD)
新西兰元(新西兰元/美元)
Crude Oil (WTI)
原油(WTI)
Japanese Yen (USD/JPY)
日元(美元/日元)
Aussie (AUD/USD)
澳元(澳元/美元)
{26}
Euro (EUR/USD)
{26}
Swissy (USD/CHF)
Swissy(美元/瑞士法郎)
US Dollar (DXY)
美元(DXY)
--- Written by Michael Boutros, Technical Currency Strategist with DailyFX
---由DailyFX技术货币策略师Michael Boutros撰写
Отказ от ответственности:
Мнения в этой статье отражают только личное мнение автора и не являются советом по инвестированию для этой платформы. Эта платформа не гарантирует точность, полноту и актуальность информации о статье, а также не несет ответственности за любые убытки, вызванные использованием или надежностью информации о статье.
WikiFX брокеры
Подсчет курса

