简体中文
繁體中文
English
Pусский
日本語
ภาษาไทย
Tiếng Việt
Bahasa Indonesia
Español
हिन्दी
Filippiiniläinen
Français
Deutsch
Português
Türkçe
한국어
العربية
US Dollar Price Forecast: FOMC Minutes May Stoke Bearish Bias
Özet:The US dollar is drifting lower ahead of the latest FOMC minutes, and with US Treasury yields also slipping, a dovish outtake could fuel the next leg lower.
US Dollar Price Analysis and Chart:
FOMC may allow inflation overshoot before even considering rate hikes.
US dollar could test support levels.
The Brand New DailyFX Q2 2019 Trading Forecast and Guides are Available to Download Now!!
The US dollar is currently edging lower ahead of Wednesdays FOMC minutes and is likely to remain range bound ahead of the release. US Treasury yields have pulled back off their recent lows but still look set to drift lower, while the 2yr – 10yr curve is positive by 16bps, after having drifted into negative territory (inversion) over the past few weeks.
This month‘s FOMC minutes is expected to highlight the Fed’s current dovishness and indicate that interest rates will be kept at current levels for an extended period. Ongoing fears that global growth is slowing further will push the Fed towards erring on the side of caution before even considering hiking rates, especially after the last Fed dot plot was moved lower. While the robust job market growth will continue to please the Fed, growth is starting to fade lower and the central bank is likely to allow inflation to overshoot its target for a short-time before looking at any interest rate hikes.
US Dollar Weekly Technical Forecast: Can USD Bulls Post a Breakout?
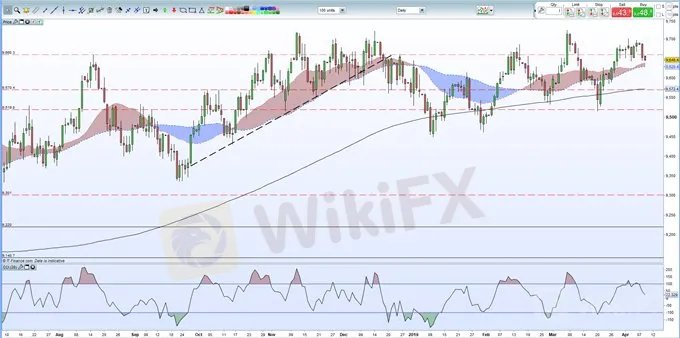
The US dollar basket (DXY) is touching a 10-day low around 96.45 after Mondays sharp sell-off. Support starts between 96.28 and 96.39 and is based on the 20- and 50-day moving average and the March 26 high/March 28 low print. Just below here lies the 50% Fibonacci retracement of the January 2017 (103.80) to February 2018 (87.94) downswing at 95.86 and the 200-day moving average at 95.73.
US Dollar Weekly Forecast: ECB Meeting, US Inflation, Fed Minutes on Tap.
USD Daily Price Chart (July 2018 – April 9, 2019)
Feragatname:
Bu makaledeki görüşler yalnızca yazarın kişisel görüşlerini temsil eder ve bu platform için yatırım tavsiyesi teşkil etmez. Bu platform, makale bilgilerinin doğruluğunu, eksiksizliğini ve güncelliğini garanti etmez ve makale bilgilerinin kullanılması veya bunlara güvenilmesinden kaynaklanan herhangi bir kayıptan sorumlu değildir.
WikiFX Broker
Son Haberler
ABD'nin petrol sondaj kulesi sayısında düşüş
 WikiFX
Haziran verileri açıklandı: Otomotiv endüstrisindan 3,4 milyar dolarlık ihracat
WikiFXOPEC+ daha fazla üretecek
WikiFXABD'den tehdit gibi tarife açıklaması
WikiFXKur Hesaplayıcı

