简体中文
繁體中文
English
Pусский
日本語
ภาษาไทย
Tiếng Việt
Bahasa Indonesia
Español
हिन्दी
Filippiiniläinen
Français
Deutsch
Português
Türkçe
한국어
العربية
Gold, Crude Oil Prices May Fall on Disappointing US GDP Revision
Lời nói đầu:Gold and crude oil prices may fall while the US Dollar attracts haven-seeking capital flows if a disappointing US GDP revision keeps investors in a downbeat mood.
GOLD & CRUDE OIL TALKING POINTS:
Gold prices inch closer toward producing bearish chart pattern
Commodities fall with stocks as US Dollar gains on haven flows
Downbeat Q4 US GDP revision may prolong risk-off disposition
Gold prices put the lie to the often-repeated mantra that the metal is some kind of “haven” asset. They fell alongside stocks, cycle-sensitive commodities including crude oil and (interestingly enough) Treasury bond yields as risk appetite deteriorated. That stoked haven demand for the US Dollar, with the benchmark currencys gains tarnishing the appeal of anti-fiat assets.
US GDP DOWNGRADE MAY PROLONG RISK-OFF MOOD, HURT COMMODITIES
Looking ahead, a revised set of fourth-quarter US GDP figures is expected to put annualized growth at 2.3 percent, a downgrade from the prior estimate of 2.6 percent. A downside surprise echoing the soggy state of recent data flow may spur continued re-risking and extend yesterdays price dynamics, with commodities broadly lower as sentiment sours and the Greenback gains.
Learn what other traders gold buy/sell decisions say about the price trend!
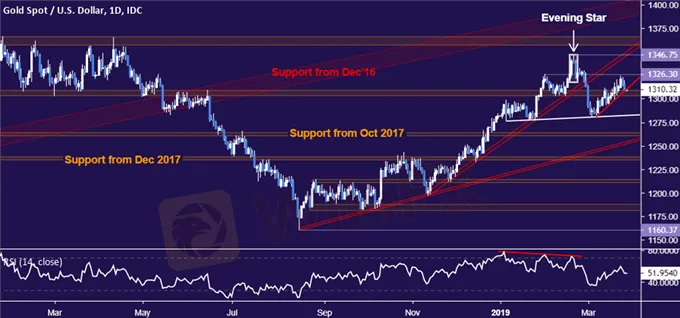
GOLD TECHNICAL ANALYSIS
Gold prices are back to testing near-term support in the 1303.70-09.12 area, teasing a break that might put them on course toward forming a choppy Head and Shoulders top. That would require a subsequent breach of the would-be patterns neckline, now at 1282.54. Initial resistance is at 1326.30, followed by the February swing top at 1346.75.
CRUDE OIL TECHNICAL ANALYSIS
Crude oil prices are treading water, but a still-valid bearish Evening Star candlestick pattern continues to warn of topping. Initial support is in the 57.24-88 area, with a daily close below that confirming a reversal and exposing the 55.37-75 zone next. Alternatively, a break above the 38.2% Fibonacci expansion at 60.45 exposes the 50% level at 62.28.

Miễn trừ trách nhiệm:
Các ý kiến trong bài viết này chỉ thể hiện quan điểm cá nhân của tác giả và không phải lời khuyên đầu tư. Thông tin trong bài viết mang tính tham khảo và không đảm bảo tính chính xác tuyệt đối. Nền tảng không chịu trách nhiệm cho bất kỳ quyết định đầu tư nào được đưa ra dựa trên nội dung này.
Sàn môi giới
IC Markets Global
FXCM
STARTRADER
Exness
IB
GO MARKETS
IC Markets Global
FXCM
STARTRADER
Exness
IB
GO MARKETS
Sàn môi giới
IC Markets Global
FXCM
STARTRADER
Exness
IB
GO MARKETS
IC Markets Global
FXCM
STARTRADER
Exness
IB
GO MARKETS
Tin HOT
Tin tức Forex 31/03: Cảnh báo về website giả mạo sàn giao dịch FP Markets
 WikiFX
Hướng dẫn nhận VPS Forex miễn phí trên WikiFX: Bí quyết nâng tầm giao dịch của bạn
WikiFXPi Network hôm nay và bí ẩn về giao dịch 922 tỷ Pi
WikiFXWikiFX Review sàn Dupoin 2025: Có đủ tiềm năng để sánh ngang Exness?
WikiFXTính tỷ giá hối đoái

