简体中文
繁體中文
English
Pусский
日本語
ภาษาไทย
Tiếng Việt
Bahasa Indonesia
Español
हिन्दी
Filippiiniläinen
Français
Deutsch
Português
Türkçe
한국어
العربية
Gold Prices Approach April Low, Hold at Symmetrial Triangle Support
Lời nói đầu:Recent changes in positioning suggest that, if a triangle breakout occurs, it would likely be to the downside.
When we last checked in on Gold prices a week ago, there was evidence (a weak US Dollar topping out) to suggest that more gains might be ahead for bullion. And while Gold prices initially rallied thereafter, the key developments that undercut the US Dollars appeal as a safe haven — dissipating concerns over the US-China trade war and Brexit – also served to undermine Gold.
In the past few days, the technical progress within the symmetrical triangle that has encapsulated price action since the start of 2019 has since been reversed. Gold prices have fallen back from near symmetrical triangle resistance and have rapidly approached symmetrical triangle support in just the span of three days.
Gold Technical Forecast: Daily Price Chart (April 2018 to April 2019) (Chart 1)
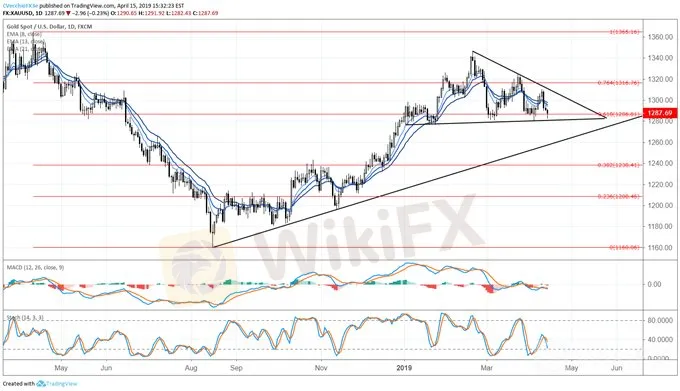
The move back towards symmetrical triangle support and the April low mean little right now as Gold prices remain within their consolidation. To this end, traders shouldnt be surprised that technical indicators are still relatively neutral.
However, there is evidence that momentum has begun to shift to the downside: price is below the daily 8-, 13-, and 21-EMA envelope; and both daily MACD and Slow Stochastics have started to turn lower below their respective median/neutral lines.
A move below the April low of 1280.80 would be a significant development in the days ahead and suggest that Gold prices may see a deeper setback towards the rising trendline from the August, September, and November 2018 lows near 1260 by the end of the month.
IG Client Sentiment Index: Spot Gold Price Forecast (April 15, 2019) (Chart 2)
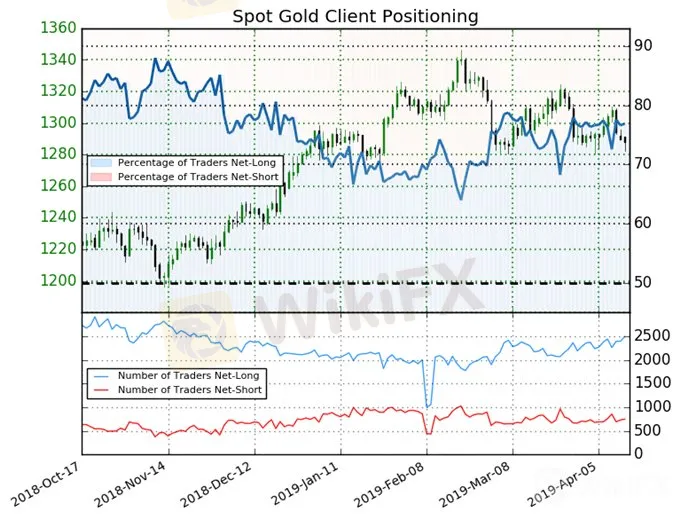
Spot Gold: Retail trader data shows 76.9% of traders are net-long with the ratio of traders long to short at 3.33 to 1. The number of traders net-long is 4.3% higher than yesterday and 9.0% higher from last week, while the number of traders net-short is 0.4% higher than yesterday and 4.5% higher from last week.
We typically take a contrarian view to crowd sentiment, and the fact traders are net-long suggests Spot Gold prices may continue to fall. Traders are further net-long than yesterday and last week, and the combination of current sentiment and recent changes gives us a stronger Spot Gold-bearish contrarian trading bias.
Miễn trừ trách nhiệm:
Các ý kiến trong bài viết này chỉ thể hiện quan điểm cá nhân của tác giả và không phải lời khuyên đầu tư. Thông tin trong bài viết mang tính tham khảo và không đảm bảo tính chính xác tuyệt đối. Nền tảng không chịu trách nhiệm cho bất kỳ quyết định đầu tư nào được đưa ra dựa trên nội dung này.
Sàn môi giới
GTCFX
FXTM
FOREX.com
Saxo
Doo Prime
ATFX
GTCFX
FXTM
FOREX.com
Saxo
Doo Prime
ATFX
Sàn môi giới
GTCFX
FXTM
FOREX.com
Saxo
Doo Prime
ATFX
GTCFX
FXTM
FOREX.com
Saxo
Doo Prime
ATFX
Tin HOT
BRICS phản đòn thuế 70% và trật tự kinh tế thế giới liệu có đổi ngôi?
 WikiFX
Nợ công Hoa Kỳ chạm đỉnh vì tăng thuế: USD sắp mất ngôi?
WikiFXTin tức Forex 07/07: Sàn môi giới đua nhau đổi mới và cải cách thương hiệu
WikiFXElon Musk thành lập đảng thứ 3: Làn sóng đổi mới chính thức bắt đầu?
WikiFXStablecoin 2025: Cơ hội hay rủi ro cho trader Việt?
WikiFXNgày 9/7: Lằn ranh đỏ mới của thương mại toàn cầu?
WikiFXTính tỷ giá hối đoái

