简体中文
繁體中文
English
Pусский
日本語
ภาษาไทย
Tiếng Việt
Bahasa Indonesia
Español
हिन्दी
Filippiiniläinen
Français
Deutsch
Português
Türkçe
한국어
العربية
Gold Price Analysis, Chart and Pivot Points
요약:Gold may re-test resistance around $1,328/oz. after US - North Korea talks fail to produce a deal.
Gold (XAU) Price, News and Chart:
US-North Korea fail to secure a deal.
Initial resistance (R1) looks likely to be tested again.
Q1 2019 Gold Forecast and Top Trading Opportunitie
US President Trump produced a sharp U-turn earlier today in Vietnam and announced that talks with North Korea had failed to produce a deal, in contrast to earlier indications that an agreement was close to being signed-off. According to reports US President Trump refused North Koreas demands for complete sanctions relief if they stopped producing materials for nuclear bombs at their Yongbyon facility. While the deal may still go through later, possibly in a revised format, any failure to make a high-profile deal will always weigh on risk sentiment.
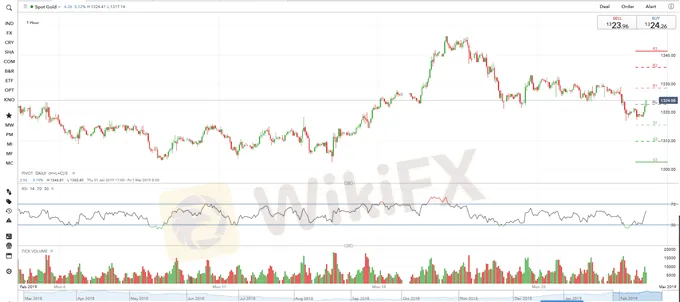
Gold has backed off its recent highs and has been unable to make a sustained break of R1 ($1,328/oz.) this week with the precious metal veering back towards, and through $1,321/oz. to S1 at $1,315.5/oz. This range continues to hold sway for now and will need a fresh macro-stimulus to break the current set-up.
Gold & Silver Price Charts – Test of Trend Support Nearing
How to Trade Gold – Top Strategies and Ti
Gold Daily Price Chart (February 6 -28, 2019)
Retail traders are 70.6% net-long Gold according to the latest IC Client Sentiment Data, a bearish contrarian indicator. Recent changes in daily and weekly sentiment however give us a stronger bearish trading bias.
What is your view on Gold – bullish or bearish? You can let us know via the form at the end of this piece or you can contact the author at nicholas.cawley@ig.comor via Twitter @nickcawley1.
면책 성명:
본 기사의 견해는 저자의 개인적 견해일 뿐이며 본 플랫폼은 투자 권고를 하지 않습니다. 본 플랫폼은 기사 내 정보의 정확성, 완전성, 적시성을 보장하지 않으며, 개인의 기사 내 정보에 의한 손실에 대해 책임을 지지 않습니다.
WikiFX 브로커
최신 뉴스
제1회 모의 투자 대회 수상자 발표
 WikiFX
벚꽃 앱테크 이벤트 당첨자 발표
WikiFX[4월 2일 거래 팁] 美 관세 발표 임박,‘불확실성 장세’에서 살아남는 법은?
WikiFX환율 계산기

