简体中文
繁體中文
English
Pусский
日本語
ภาษาไทย
Tiếng Việt
Bahasa Indonesia
Español
हिन्दी
Filippiiniläinen
Français
Deutsch
Português
Türkçe
한국어
العربية

GBPUSD Crumbles as The US Dollar Continues its Pre-FOMC Run
요약:GBPUSD now back at lows last seen over 27 months ago driven by a combination of Brexit fears and a rampant US dollar.
Sterling (GBP) Price, Chart and Analysis:
US dollar rallies into the FOMC meeting.
GBPUSD chart breaks down.
Q3 2019 GBP Forecast andTop Trading Opportunities
GBPUSD Back at March 2017 Lows as US Dollar Rallies
The great US dollar rally continues with the greenback approaching a fresh two-year+ high, despite markets fully expecting a 25-basis point interest rate cut at Wednesday‘s FOMC meeting. The US dollar continues to benefit from both the Euro and Sterling’s struggles, and the likelihood is that both will continue to slip lower. The German bond market continues to highlight the weakness in the Euro with yields now negative out to 20-years while the 30-year long bond offers just 19 basis points. The ECB is fully expected to cut rates at its September meeting and will likely re-start QE this year.
US Dollar Basket (December 2018 - July 29, 2019)
Sterling remains weak and is trading at a 2-year+ low against the SU dollar as the UK ratchets up expectations of leaving the EU with or without a deal on October 31. The British Pound may also underperform with this week‘s Bank of England ’Super Thursday expected to show a more dovish twist, further undermining GBP.
GBPUSD broke out of the symmetrical triangle we wrote about last week and may see further losses in the short-term. The technical set-up remains weak although the CCI indicator is at extreme levels (oversold) on the daily chart and this may temper the move lower. On a weekly chart there are two old higher lows at 1.2109 and 1.1983 before the October 2016 spike-low at 1.1800, all of which may tempt Sterling bears.
Keep up to date with all key economic data and event releases via the DailyFX Economic Calendar
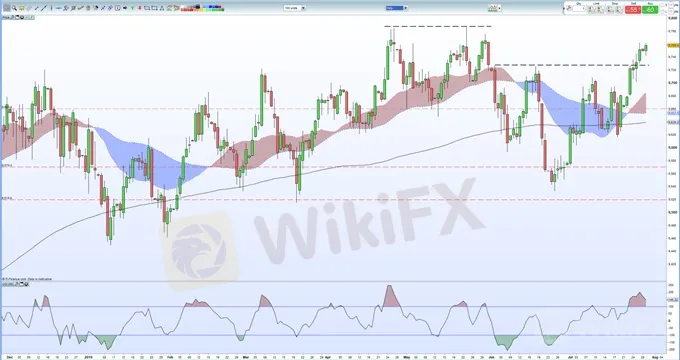
GBPUSD Daily Price Chart (December 2018 – July 29, 2019)

Retail traders are 82.0% net-long GBPUSD according to the latest IG Client Sentiment Data, a bearish contrarian indicator. However recent daily and weekly positional changes give us a stronger bearish contrarian GBPUSD trading bias.
GBPUSD Weekly Price Chart (February 2016 – July 29, 2019)

면책 성명:
본 기사의 견해는 저자의 개인적 견해일 뿐이며 본 플랫폼은 투자 권고를 하지 않습니다. 본 플랫폼은 기사 내 정보의 정확성, 완전성, 적시성을 보장하지 않으며, 개인의 기사 내 정보에 의한 손실에 대해 책임을 지지 않습니다.
WikiFX 브로커
최신 뉴스
제1회 모의 투자 대회 수상자 발표
 WikiFX
벚꽃 앱테크 이벤트 당첨자 발표
WikiFX[4월 2일 거래 팁] 美 관세 발표 임박,‘불확실성 장세’에서 살아남는 법은?
WikiFX환율 계산기

