简体中文
繁體中文
English
Pусский
日本語
ภาษาไทย
Tiếng Việt
Bahasa Indonesia
Español
हिन्दी
Filippiiniläinen
Français
Deutsch
Português
Türkçe
한국어
العربية
Gold Price Outlook: Support Holds, FOMC-Fuelled Breakout Looms
요약:The daily gold price chart shows the recent uptrend support line holding firm while resistance now looks increasingly vulnerable. Will the FOMC break the impasse?
Gold (XAU) Price Outlook, Analysis and Chart
Gold coiled and ready to breakout.
FOMC the likely trigger.
Q3 2019 Gold Forecast and Top Trading Opportunities
Gold Readies to Break Higher if FOMC Accommodative
The daily gold price chart continues to show the precious metal trapped in a symmetrical triangle pattern with a breakout imminent, just one day before the FOMC meeting. Gold has been biding its time, and trading in a narrowing range, ahead of the Fed rate decision where the central bank is fully expected to cut interest rates by 0.25%, while expectations grow that a 0.50% cut may well happen. The price of gold moves higher when US interest rates move lower.
Live Coverage of the FOMC Rate Decision – Register Here.
A clean break, and close, above resistance will open the way to re-test the June 25 high at $1,439.4/oz. before the July 18 high at $1,453.0/oz. If we trade above this high, then gold will be back at levels not seen since May 2013. Downside protection at $1,411.0/oz. ahead of $1,400/oz. and $1,386/oz. Gold remains above all three moving averages, including the important 200-day ma, while the CCI indicator remains supported and looks set to move higher again.
200-Day Moving Average: What it is and How it Works.
The DailyFX Calendar covers all important market moving data releases and events.
Gold Price Daily Chart (January – July 30, 2019)
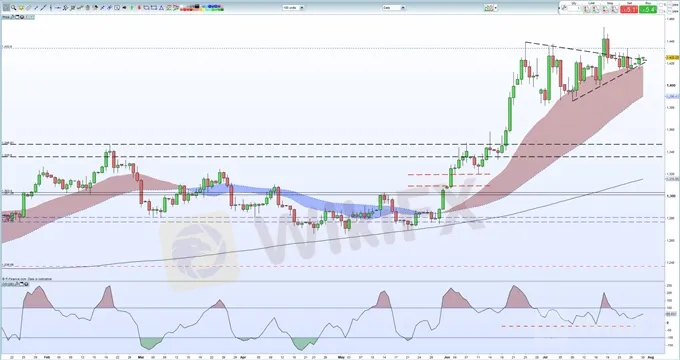
IG Client Sentiment data show that 69.8% of retail traders are net-long of gold, a bearish contrarian indicator. However, recent daily and weekly positional changes give us a stronger bearish contrarian bias.
면책 성명:
본 기사의 견해는 저자의 개인적 견해일 뿐이며 본 플랫폼은 투자 권고를 하지 않습니다. 본 플랫폼은 기사 내 정보의 정확성, 완전성, 적시성을 보장하지 않으며, 개인의 기사 내 정보에 의한 손실에 대해 책임을 지지 않습니다.
WikiFX 브로커
최신 뉴스
제1회 모의 투자 대회 수상자 발표
 WikiFX
벚꽃 앱테크 이벤트 당첨자 발표
WikiFX[4월 2일 거래 팁] 美 관세 발표 임박,‘불확실성 장세’에서 살아남는 법은?
WikiFX환율 계산기

