简体中文
繁體中文
English
Pусский
日本語
ภาษาไทย
Tiếng Việt
Bahasa Indonesia
Español
हिन्दी
Filippiiniläinen
Français
Deutsch
Português
Türkçe
한국어
العربية
Gold Price Leaps to 6-Year High on Trade War Bid, Silver Battles Resistance
요약:Gold continued to soar, boosted by a strong risk-off move as US-China trade relations continue to deteriorate. Silver playing catch-up and nears recent resistance.
Gold (XAU) Price, Silver Price (XAG) Analysis and Chart
Gold continues its post-FOMC rally, powered by a fresh risk-off bid.
Silver needs to break resistance for move to continue.
Q3 2019 Gold Forecast and Top Trading Opportunities
Gold Up $60 since FOMC Decision, US-China Trade Wars Drive the Move
The price of gold is up around 4% since last week‘s FOMC decision and today’s move is being fueled by a ratcheting up of trade tensions between the US and China which has sparked a global risk-off move. US President Donald Trump turned up the pressure on China last week by slapping a 10% tariff on $300 billion of Chinese imports, in addition to the 25% on $250 billion of Chinese goods already in effect. In retaliation, China has let USDCNH weaken above 7.00, to counteract the tariffs, a move that will infuriate the US and may bring further punitive action.
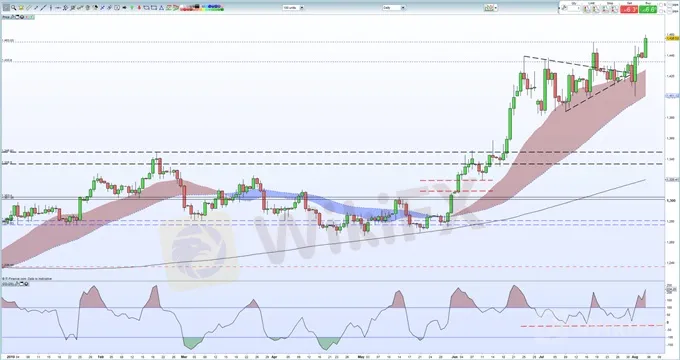
The daily gold chart continues to look positive but is also flashing a strong overbought signal which may temper any further short-term rally. Gold broke above the recent six-year high at $1,453/oz. and a close and consolidation above this level will bring the May 2013 high of $1,488/oz. into view before $1,551/oz. comes into play. Support seen between $1,433/oz. and $1,437/oz.
The DailyFX Calendar covers all important market moving data releases and events.
Gold Price Daily Chart (January - August 5, 2019)
IG Client Sentiment data show that 62.0% of retail traders are net-long of gold, a bearish contrarian indicator. However, recent daily and weekly positional changes give us a bullish contrarian bias.
How to Trade Gold: Top Gold Trading Strategies and Tips
Silver Held Back by Technical Resistance
Silvers recent sell-off has been reversed and is now looking at breaking back above recent highs and an important Fibonacci retracement level. The recent double-high at $16.65/oz. is guarded by the 61.8% retracement level at $16.57/oz. with two other intra-day highs in-between. Silver needs a break and close above $16.65/oz. before it can re-test the June 14, 2018 swing-high at $17.32/oz. A cluster of lows between $16.12/oz. and $16.17/oz. provides support.
Silver Daily Price Chart (November 2018 – August 5, 2019)

How to Trade Silver: Top Trading Strategies
Traders may be interested in two of our trading guides – Traits of Successful Traders and Top Trading Lessons – while technical analysts are likely to be interested in our latest Elliott Wave Guide.
면책 성명:
본 기사의 견해는 저자의 개인적 견해일 뿐이며 본 플랫폼은 투자 권고를 하지 않습니다. 본 플랫폼은 기사 내 정보의 정확성, 완전성, 적시성을 보장하지 않으며, 개인의 기사 내 정보에 의한 손실에 대해 책임을 지지 않습니다.
WikiFX 브로커
최신 뉴스
제1회 모의 투자 대회 수상자 발표
 WikiFX
벚꽃 앱테크 이벤트 당첨자 발표
WikiFX[4월 2일 거래 팁] 美 관세 발표 임박,‘불확실성 장세’에서 살아남는 법은?
WikiFX환율 계산기

