简体中文
繁體中文
English
Pусский
日本語
ภาษาไทย
Tiếng Việt
Bahasa Indonesia
Español
हिन्दी
Filippiiniläinen
Français
Deutsch
Português
Türkçe
한국어
العربية
Gold Prices Menace Chart Support as Focus Turns to US Retail Sales
บทคัดย่อ:Gold prices continue to pressure chart support guiding the uptrend from November as investors eye US retail sales data. Crude oil prices resilience may be
GOLD & CRUDE OIL TALKING POINTS:
Gold prices fell on more modest disinflation than analysts expected
Crude oil prices rose in risk-on trade, ignoring IEA and DOE data
US retail sales statistics and monthly API report now in the spotlight
Gold price seesawed with the release of January‘s US CPI data, initially jumping higher as the benchmark on-year inflation rate fell to 1.6 percent – the lowest level since September – but swiftly reversing downward. The drop was more modest than economists’ projected decline to 1.5 percent, which might explain the prompt reversal. The US Dollar tellingly rose as the figures hit the wires.
Crude oil prices traded higher in the meanwhile, shrugging off a larger-than-expected weekly build in inventories and a monthly IEA report projecting oversupply in 2019 as swelling non-OPEC output swamps cooling demand. A modestly risk-on bias appeared to account for this resilience, driven by hopes for a breakthrough in US-China trade talks and the fading threat of another US government shutdown.
US RETAIL SALES DATA, MONTHLY API REPORT ON TA
Looking ahead, December‘s US retail sales report may punish gold if the outcome echoes the recent tendency of data flow from the world’s largest economy to outperform relative to forecasts. Meanwhile, crude oils defiant strength will be tested once again as the monthly API statistical report is released. It may serve as yet another reminder of the adverse fundamental landscape.
Learn what other traders gold buy/sell decisions say about the price trend!
GOLD TECHNICAL ANALYSI
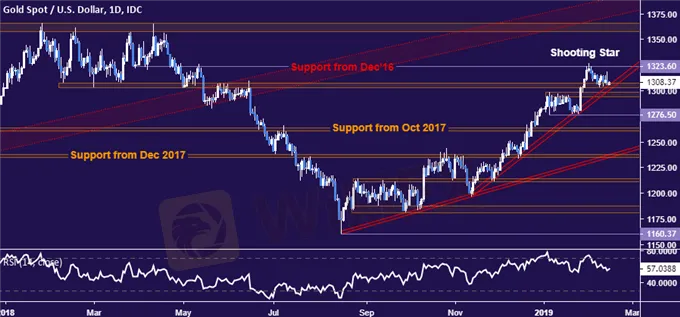
Gold prices remain stuck above a dense support range above 1294.10. A daily close below this barrier would breach the bounds of the upswing from mid-November, exposing 1276.50 initially. Alternatively, a conclusive break above resistance at 1323.60 opens the door for a challenge of the trend-defining barrier in the 1357.50-66.06 area.

CRUDE OIL TECHNICAL ANALYSI
Crude oil prices rose to retest near-term resistance, but a bearish Evening Star candlestick pattern continues to hint that a top is in the works. The setup would be invalidated on a daily close above the February 4 high at 55.75, with such a move exposing the 57.96-59.05 area next. Alternatively, a breach below support in the 49.41-50.15 zone sets the stage for a move toward retesting the 42.05-55 region.

COMMODITY TRADING RESOURCE
See our guide to learn about the long-term forces driving crude oil price
Having trouble with your strategy? Heres the #1 mistake that traders make
Join a Trading Q&A webinar to answer your commodity market questio
ข้อจำกัดความรับผิดชอบ:
มุมมองในบทความนี้แสดงถึงมุมมองส่วนตัวของผู้เขียนเท่านั้นและไม่ถือเป็นคำแนะนำในการลงทุน สำหรับแพลตฟอร์มนี้ไม่รับประกันความถูกต้องครบถ้วนและทันเวลาของข้อมูลบทความ และไม่รับผิดชอบต่อการสูญเสียใด ๆ ที่เกิดจากการใช้ข้อมูลในบทความ
WikiFX โบรกเกอร์
Pepperstone
OANDA
ATFX
Exness
IC Markets Global
FXCM
Pepperstone
OANDA
ATFX
Exness
IC Markets Global
FXCM
WikiFX โบรกเกอร์
Pepperstone
OANDA
ATFX
Exness
IC Markets Global
FXCM
Pepperstone
OANDA
ATFX
Exness
IC Markets Global
FXCM
ข่าวล่าสุด
ดอลล์แข็งค่าเล็กน้อย จับตาภาษีรัฐบาลสหรัฐ-ถ้อยแถลงพาวเวล
9 ข้อสังเกต Crypto Scam
Bybit ยกธงขาว! ขอลา NFT หลังเจอวิกฤติผู้ใช้ลดลงอย่างรวดเร็ว
เฟดอาจลดดอกเบี้ย 3-4 ครั้งในปีนี้ หลังสหรัฐฯ ประกาศมาตรการภาษีศุลกากร
CMCMarkets น่าใช้ไหม! มีข้อดี-ข้อเสียอะไรบ้าง?
Fortrade น่าใช้ไหม! มีข้อดี-ข้อเสียอะไรบ้าง?
ภาษีสหรัฐฯแย่กว่าที่คิด! เสี่ยงต่อภาวะถดถอย
บทเรียนจากเหตุการณ์จริง! แผ่นดินไหวพลิกตลาดการเงิน
นักวิเคราะห์ของ Citi คาดเฟดจะลดดอกเบี้ย 5 ครั้งในปีนี้
เทรดยังไงให้ชนะหลังเกิดแผ่นดินไหว บทความนี้มีคำตอบ!
คำนวณอัตราแลกเปลี่ยน


