简体中文
繁體中文
English
Pусский
日本語
ภาษาไทย
Tiếng Việt
Bahasa Indonesia
Español
हिन्दी
Filippiiniläinen
Français
Deutsch
Português
Türkçe
한국어
العربية

Sterling Price Outlook: GBPUSD and EURGBP Analysis
บทคัดย่อ:Sterling remains in tight trading ranges as Brexit negotiations continue. While the outcome of the EU/UK talks remains key, Sterling charts continue to have a positive bias.
GBPUSD and EURGBP Price Analysis:
GBPUSD using trend support to aid push higher.
EURGBP may re-test lows last seen two weeks ago.
The Brand New DailyFX Q2 2019 Trading Forecast and Guides are Available to Download Now!!
GBPUSD – Technical Outlook
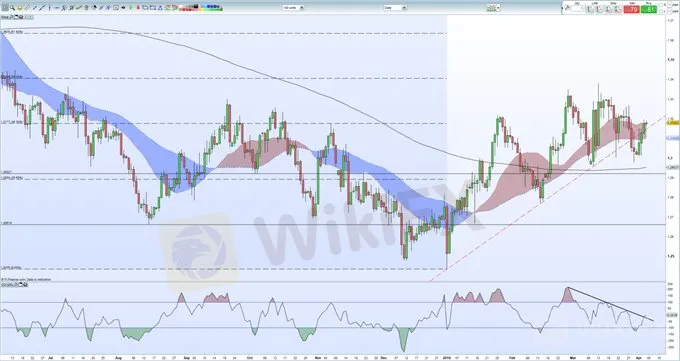
GBPUSD is nudging higher this week in relatively low vol markets and is now using the recently broken bull trend line as support. Today‘s open above trend is a positive signal with the pair also pushing back above the 38.2% Fibonacci retracement level at 1.3177. The pair have also made five higher lows in a row – disregarding Sunday’s candle – off the 1.2977 low and just trade above all three moving averages. The CCI indicator is mid-market although the five-week downtrend looks to be breaking out to the upside.
GBPUSD Price Outlook: Sterling Technicals Turning Positive.
GBPUSD Daily Price Chart (June 2018 – April 4, 2019)
Retail traders are 57.3% net-long GBPUSD according to the latest IG Client Sentiment Data, a bearish contrarian indicator. See how recent daily and weekly positional changes can move client sentiment.
EURGBP – Technical Outlook
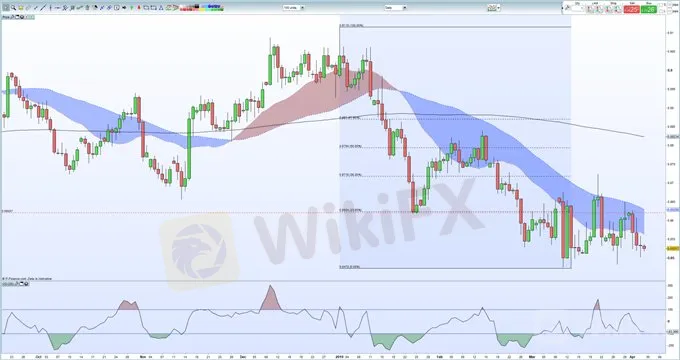
EURGBP continues to fade lower and the market looks likely to press recent multi-month lows with little in the way of support evident on the daily price chart. The recent re-test of the 23.6% Fibonacci retracement level at 0.8624 failed with the pair now one cent lower over the last three sessions. This move also took EURGBP under the 20- and 5-day moving averages, another negative sign on the chart. The CCI indicator is nearing oversold territory which may act as a brake on the slide lower, but overall the chart remains negative. To the downside the recent 0.8472 low is the initial target followed by two old swing longs (December 2017 and April 2017) between 0.8304 and 0.8314.
EURGBP Daily Price Chart (September 2018 – April 4, 2019)
Traders may be interested in two of our trading guides – Traits of Successful Traders and Top Trading Lessons – while technical analysts are likely to be interested in our latest Elliott Wave Guide.
What is your view on Sterling – bullish or bearish? You can let us know via the form at the end of this piece or you can contact the author at nicholas.cawley@ig.comor via Twitter @nickcawley1.
ข้อจำกัดความรับผิดชอบ:
มุมมองในบทความนี้แสดงถึงมุมมองส่วนตัวของผู้เขียนเท่านั้นและไม่ถือเป็นคำแนะนำในการลงทุน สำหรับแพลตฟอร์มนี้ไม่รับประกันความถูกต้องครบถ้วนและทันเวลาของข้อมูลบทความ และไม่รับผิดชอบต่อการสูญเสียใด ๆ ที่เกิดจากการใช้ข้อมูลในบทความ
WikiFX โบรกเกอร์
STARTRADER
TMGM
FXTM
IC Markets Global
GO MARKETS
Pepperstone
STARTRADER
TMGM
FXTM
IC Markets Global
GO MARKETS
Pepperstone
WikiFX โบรกเกอร์
STARTRADER
TMGM
FXTM
IC Markets Global
GO MARKETS
Pepperstone
STARTRADER
TMGM
FXTM
IC Markets Global
GO MARKETS
Pepperstone
ข่าวล่าสุด
เหตุการณ์สำคัญทางเศรษฐกิจที่น่าสนใจสัปดาห์นี้
 WikiFX
ระวัง! 5 พฤติกรรมทำลายเครดิตแบบไม่รู้ตัว
WikiFXเศรษฐกิจชะงัก! จีดีพีไตรมาส 2 ติดลบ! เพราะแผ่นดินไหว
WikiFXการรับมือแผ่นดินไหว ฉบับนักเทรด
WikiFXเตือนภัย! กลโกงใหม่ มิจฉาชีพหลอกขโมยคริปโตผ่าน LinkedIn
WikiFXพฤติกรรมการลงทุนของ Gen ต่างๆ
WikiFX5 อันดับโบรกเกอร์ ยอดนิยมในประเทศไทย ประจำเดือนมีนาคม
WikiFXคำนวณอัตราแลกเปลี่ยน

